
Your production goals look clear, yet daily firefighting pulls managers into decisions that dilute priorities, stall output, and blur ownership across shifts. You feel pressure to deliver predictable results while teams chase metrics, react to issues, and question how goals connect to work.
What you need is a way to set clear priorities, track progress that matters, and create accountability without adding process drag. This guide shares practical OKR examples for manufacturing and explains how OKRs can translate leadership intent into focused execution that teams understand and act on.
Key Takeaways:
- OKRs help manufacturing leaders focus on a small set of production results that must change within a quarter.
- KPIs show production health, while OKRs drive improvement when leaders need movement on specific outcomes.
- Strong Key Results use production metrics that teams can influence during daily work, not activity checklists.
- Clear ownership and regular reviews keep OKRs relevant amid shifting production pressure.
- OKRs fail when leaders overload goals or treat them as performance ratings instead of decision guides.
What OKRs Mean for Manufacturing Leaders
For manufacturing leaders, OKRs act as a focus system for results that must change within a quarter. They help you state what must improve and how progress will be measured. They exist to guide decisions when production pressure rises.
Instead of tracking everything, OKRs force priority choices that leaders stand behind. Here’s how OKRs differ from KPIs in manufacturing:
| Aspect | OKRs | KPIs |
| Purpose | Drive change within a set period | Monitor ongoing performance |
| Time frame | Short-term, usually quarterly | Continuous |
| Nature | Directional and outcome-based | Operational and status-based |
| Scope | Few, leadership-owned priorities | Many, team or function-owned |
| Use case | Improve specific production results | Track production health |
| Risk | Missed if priorities are unclear | Ignored if seen as routine |
KPIs show whether production stays stable. OKRs define where leaders want movement this quarter. Use KPIs to spot issues early. Use OKRs to push focused improvement where it matters most.
Understanding the concept is useful, but seeing practical examples helps you connect OKRs with actual shop-floor decision making and accountability.
Also Read: OKR Guide: Types, Benefits, Implementation & Best Practices

OKR Examples for Manufacturing Organizations
Examples help teams see how goals translate into daily decisions. Each objective focuses on a single production outcome that leaders want to change this quarter. Key Results reflect measurable movement, not activity lists.
These examples reflect practical OKRs used across manufacturing departments:
Production & Operations
1. Objective: Maximize Throughput on the Primary Assembly Line
- KR 1: Increase units per hour (UPH) from 45 to 55 without increasing labor hours.
- KR 2: Reduce bottlenecks at the welding station, cutting wait time by 20%.
- KR 3: Maintain labor coverage above 98% during peak production weeks.
2. Objective: Achieve World-Class Overall Equipment Effectiveness (OEE)
- KR 1: Increase OEE score from 72% to 85% on critical assets.
- KR 2: Reduce minor stops (idling) by 30% through improved operator training.
- KR 3: Increase availability by reducing unplanned downtime by 15%.
3. Objective: Optimize Production Changeover Speed
- KR 1: Reduce the average Single-Minute Exchange of Die (SMED) time from 45 minutes to 25 mins.
- KR 2: Standardize changeover kits for the top 5 SKUs.
- KR 3: Train 100% of shift leads on the new rapid-changeover protocol.
Quality Control & Assurance
4. Objective: Drive Near-Zero Defect Levels in Finished Goods
- KR 1: Improve First-Pass Yield (FPY) from 91% to 98%.
- KR 2: Reduce internal scrap costs by $50k per month.
- KR 3: Achieve 0% “Red-Tag” incidents during weekly quality audits.
5. Objective: Enhance Customer Satisfaction via Product Reliability
- KR 1: Reduce customer-reported defects (RMAs) from 2.5% to less than 1%.
- KR 2: Decrease average complaint resolution time from 14 days to 5 days.
- KR 3: Pass 100% of external ISO certification audits with zero major non-conformities.
Maintenance & Reliability
6. Objective: Shift from Reactive to Proactive Asset Management
- KR 1: Increase the ratio of Preventive Maintenance (PM) vs. Reactive work to 85/15.
- KR 2: Reduce “Mean Time to Repair” (MTTR) by 20% through localized tool cribs.
- KR 3: Ensure 100% of critical spare parts are in stock and tracked via CMMS.
7. Objective: Eliminate Chronic Downtime on High-Value Assets
- KR 1: Increase Mean Time Between Failures (MTBF) on the CNC line from 120 to 200 hours.
- KR 2: Complete 100% of the quarterly predictive maintenance (PdM) schedule.
- KR 3: Reduce emergency maintenance overtime costs by 30%.
Supply Chain & Logistics
8. Objective: Strengthen Vendor Performance and Reliability
- KR 1: Improve raw material on-time delivery (OTD) from 84% to 95%.
- KR 2: Reduce the number of quality-rejected raw material batches by 40%.
- KR 3: Consolidate the vendor base by 15% to leverage volume discounts.
9. Objective: Optimize Inventory Health and Flow
- KR 1: Increase the inventory turnover ratio from 6 to 9.
- KR 2: Reduce “Work in Progress” (WIP) aging from an average of 5 days to 2 days.
- KR 3: Reduce warehouse storage costs by 10% through a JIT (Just-in-Time) pilot on 10 SKUs.
Health, Safety, and Environment (HSE)
10. Objective: Build a World-Class Safety Culture
- KR 1: Achieve 365 consecutive days without a Lost Time Incident (LTI).
- KR 2: Increase “Near-Miss” reporting by 50% to identify risks before accidents occur.
- KR 3: Train 100% of shop-floor employees on updated Lockout-Tagout (LOTO) procedures.
11. Objective: Minimize Manufacturing Carbon Footprint and Waste
- KR 1: Reduce energy consumption per unit produced by 15%.
- KR 2: Divert 90% of production waste from landfills to recycling partners.
- KR 3: Reduce water usage in cooling processes by 20% through closed-loop recycling.
Workforce & Plant Culture
12. Objective: Improve Shop-Floor Employee Engagement and Retention
- KR 1: Reduce voluntary turnover among skilled operators from 15% to 8%.
- KR 2: Implement 10 employee-led process improvement ideas (Kaizens) per month.
- KR 3: Achieve an 80% or higher score on the quarterly Employee Net Promoter Score (eNPS).
13. Objective: Close the Skills Gap via Cross-Training
- KR 1: Ensure 75% of operators are certified to work on at least three different machines.
- KR 2: Create a digital “Skills Matrix” and update it weekly with 100% accuracy.
- KR 3: Launch a mentorship program with 10 pairs of senior-to-junior technicians.
Engineering & R&D
14. Objective: Accelerate the “Prototype to Production” Lifecycle
- KR 1: Reduce New Product Introduction (NPI) lead time by 25%.
- KR 2: Ensure 100% of new designs pass the “Manufacturability Review” on the first attempt.
- KR 3: Reduce the cost of first-article builds by 20%.
15. Objective: Modernize Production with Industrial IoT (IIoT)
- KR 1: Install real-time sensors on the top 3 critical machines by the end of Q2.
- KR 2: Integrate machine data into a live dashboard visible to all shift managers.
- KR 3: Reduce manual data entry hours by 15% through automated cycle counting.
Seeing these use cases makes it easier to understand how OKRs influence daily behavior and improve production outcomes across teams.
Also Read: OKRs in Business: The Secret to Goal Alignment and Success
How OKRs Help Manufacturing Teams Improve Results
Production goals fail when priorities shift daily, and teams lack a shared view of what matters most. OKRs work because they convert leadership intent into visible outcomes that guide decisions on the floor. They create focus without adding layers of reporting.
Here’s why OKRs fit production environments:
- Quarterly priority focus: OKRs require leaders to select a small number of outcomes that truly matter within a defined time frame.
- Strategy-to-floor alignment: They link executive objectives directly to the daily actions of plant and production managers.
- Progress visibility without meetings: Teams track performance in real time instead of relying on lengthy status discussions.
- Smarter trade-off decisions: OKRs help teams balance capacity, quality, and delivery when constraints collide.
- Outcome ownership: Teams stay accountable for results rather than just completing assigned tasks.
- Early course correction: Clear metrics reveal issues early, allowing adjustments before targets are missed.
The success of OKRs depends less on intent and more on choosing manufacturing measures that guide daily decisions.
Also Read: Cascading vs. Alignment: Which Approach Works Best for Your Organization?
Manufacturing Metrics That Drive Meaningful OKR Progress
Key Results work only when they reflect progress leaders care about and teams can influence daily. Weak metrics turn OKRs into status tracking instead of change drivers. Strong metrics create clarity during trade-offs and shift conversations from effort to results.
Here are production metrics that work well as Key Results:
- Cycle time reduction tied to specific process steps
- First-pass yield improvement across critical lines
- Unplanned downtime reduction during peak shifts
- On-time delivery rate for priority orders
- Scrap or rework reduction within defined thresholds
- Throughput increase on constrained resources
Clear metrics provide the foundation you need before moving into the practical steps of setting manufacturing OKRs.
Also Read: What Key Performance Metrics for Managers are Beneficial?
How to Set Manufacturing OKRs Step by Step
Production OKRs succeed when leaders keep them few, clear, and visible. The goal is not perfect wording but shared understanding across leadership and plant teams. This process keeps focus on results that must move within the quarter.
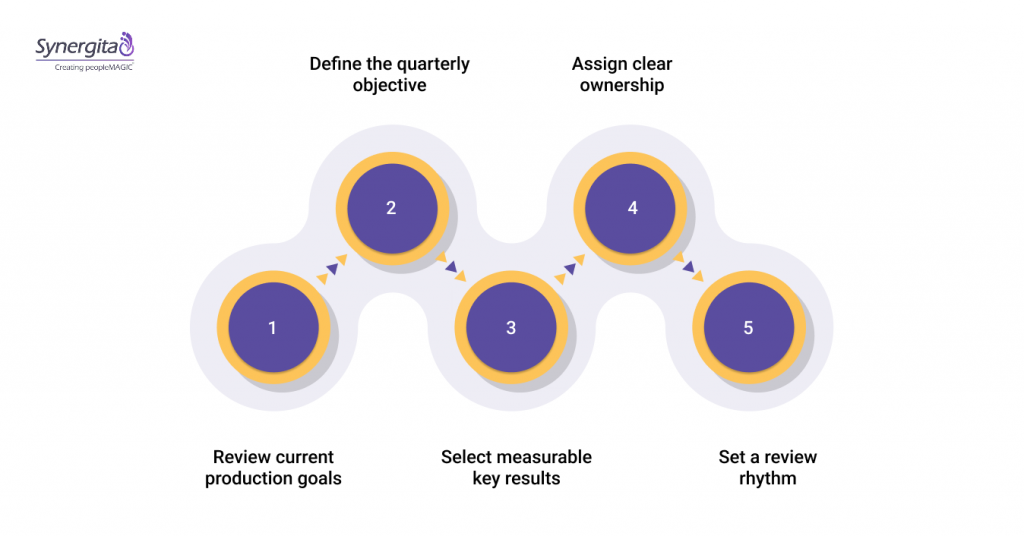
Here are the steps to set production OKRs:
- Review current production goals: Identify targets that leadership already tracks but struggles to move.
- Define the quarterly objective: State the single production outcome that matters most right now.
- Select measurable key results: Choose three to four results that teams can influence during daily work.
- Assign clear ownership: Name one accountable owner per key result.
- Set a review rhythm: Check progress during existing ops or staff meetings, not separate sessions.
A clear process becomes easier to apply when manufacturing OKRs stays visible in one place, which tools like Synergita support by keeping goals, owners, and progress accessible across teams.
Also Read: 4 Steps on How to Build an Effective Performance Management Program
Even with a clear setup process, mistakes can weaken impact if you apply OKRs without consistent leadership discipline.

Common OKR Mistakes Manufacturing Leaders Should Avoid
Most OKR failures come from how leaders apply them, not from the framework itself. When misused, OKRs add noise instead of focus and weaken trust across teams. Avoiding these mistakes keeps attention on results that matter during the quarter.
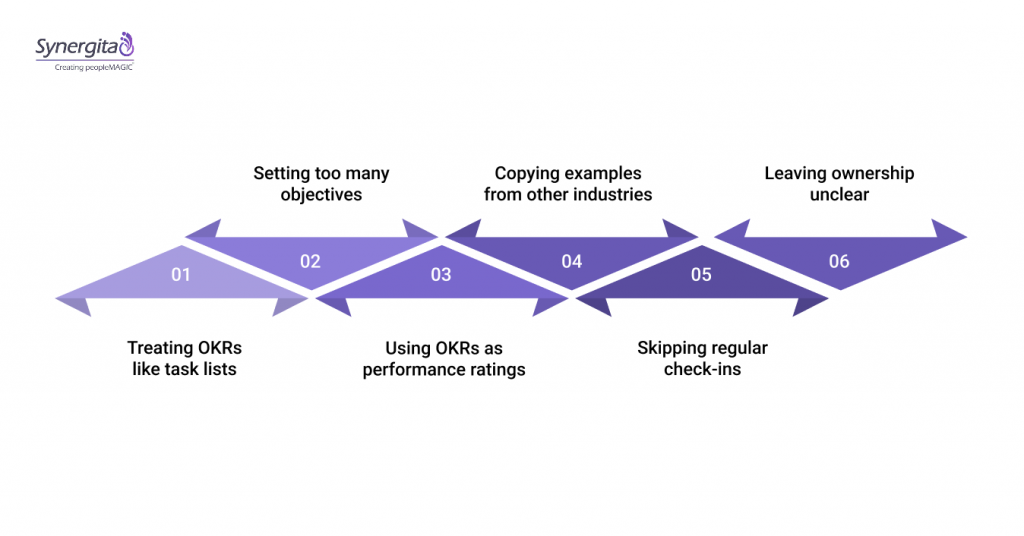
Here are common OKR mistakes manufacturing leaders should watch for:
- Treating OKRs like task lists: Listing activities instead of results shifts focus away from measurable production change
- Setting too many objectives: An excess of goals forces teams to spread effort and ignore trade-offs
- Using OKRs as performance ratings: Linking OKRs to compensation discourages honest progress reporting
- Copying examples from other industries: Generic goals fail to reflect production constraints and shop-floor realities
- Skipping regular check-ins: Without reviews, OKRs fade behind daily issues and lose relevance
- Leaving ownership unclear: Shared ownership often results in no ownership when targets slip
Avoiding these mistakes allows you to use OKRs as a steady guide rather than another short-lived management exercise.
Conclusion
Production goals improve when leaders create clarity around what must change and how progress gets reviewed. Using OKR examples for manufacturing, teams gain a shared view of priorities, results, and ownership without adding noise to daily operations. When applied with care, they help leaders move from constant reaction to predictable execution.
The difference comes from how OKRs are tracked, reviewed, and kept visible across teams. Without a system, intent fades, and updates rely on memory or scattered files. With the right structure, OKRs stay active, transparent, and grounded in results that matter.
Discover how Synergita helps manufacturing leaders track OKRs, build accountability, and keep production goals visible across teams. Book a demo today.
FAQs
1. What is an OKR in product management?
In product management, an OKR defines what outcome a product team must achieve and how success is measured. It keeps teams focused on customer impact, delivery milestones, or adoption goals within a fixed time frame. The emphasis stays on results, not feature output.
2. What is the difference between OKRs and KRAs (Key Result Areas)?
Key Result Areas (KRAs) describe areas of responsibility tied to a role. OKRs define specific outcomes that should improve within a period. KRAs stay constant, while OKRs change based on business priorities.
3. What is OKR vs MBO (Management by Objectives)?
Management by Objectives (MBO) focuses on individual goals set annually and reviewed after the fact. OKRs focus on shared priorities, short cycles, and visible progress. OKRs encourage course correction during the cycle, not just evaluation at the end.
4. How often should manufacturing OKRs change?
Manufacturing OKRs usually change every quarter. This cadence gives teams enough time to influence results while staying responsive to shifts in demand or capacity. Monthly changes create noise, while annual cycles reduce focus.
5. Can shop-floor teams work with OKRs without extra reporting?
Yes, when OKRs connect to metrics that teams already track. Progress updates can happen during existing shift reviews or ops meetings. The key is keeping OKRs visible and discussed, not adding new reports.