

High-performing ML models often fail to deliver expected business value. Teams celebrate technical achievements like model accuracy while missing tangible impacts on revenue or efficiency. This disconnect turns AI initiatives from strategic assets into costly science projects.
You need a framework that directly connects technical work to measurable business outcomes. Implementing a structured OKR for a machine learning strategy bridges this gap between research and results.
This guide provides a practical system to align your data science efforts with organizational goals. You will discover 20 actionable OKR examples across three strategic categories, moving from tracking experiments to driving measurable business improvements.
Key Takeaways
- Successful ML OKRs measure business changes, such as revenue lift, rather than just technical model metrics.
- Aligning research milestones with product cycles prevents technical debt and ensures faster time-to-market for AI features.
- OKRs provide the necessary flexibility for the experimental nature of data science while maintaining a high-level strategic focus.
- Using shared objectives ensures that data scientists, engineers, and product managers work toward a unified vision.
- Prioritizing MLOps objectives reduces the cost of inference and improves the speed of model deployment.
- Linking model performance to organizational values improves transparency and builds trust across non-technical departments.
Importance of OKRs for Machine Learning
Machine learning is inherently non-linear and experimental, making rigid deadlines difficult to maintain without sacrificing quality. A structured goal-setting system allows teams to define clear success criteria while providing the autonomy to pivot technical approaches.
This discipline ensures that high-cost talent stays focused on the problems that offer the highest potential for impact. Standardizing your performance measurement through this framework offers several strategic advantages for your leadership team:
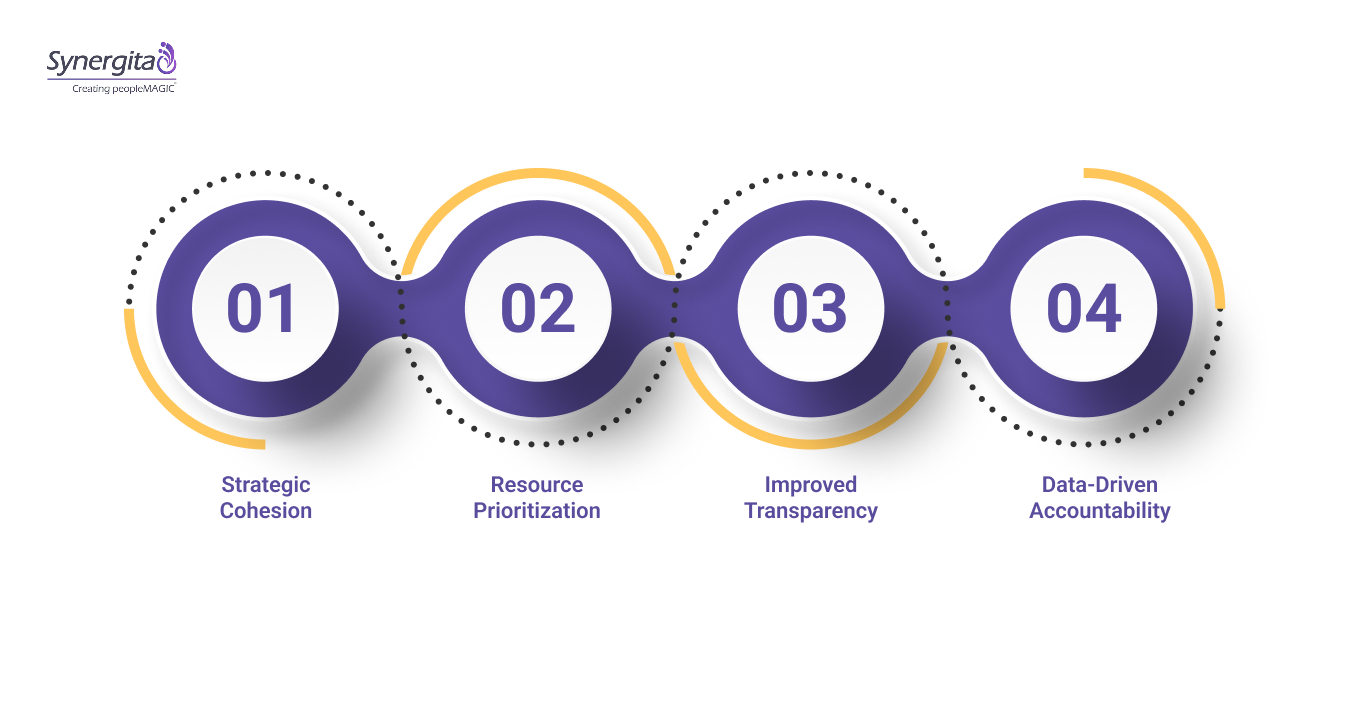
- Strategic Cohesion: Connects complex model development tasks directly to the company’s core mission and revenue objectives.
- Resource Prioritization: Helps managers identify which experiments deserve more compute resources based on their projected impact on key results.
- Improved Transparency: Provides a common language for technical teams to communicate progress and roadblocks to non-technical executive stakeholders.
- Data-Driven Accountability: Establishes clear, numerical benchmarks for success that move beyond subjective opinions about model quality.
Establishing this foundational clarity allows your team to move beyond the research lab and into the production environment.
Also read:Are You Tracking the Right Metrics for Employee Retention in 2025?
The 3 Core Machine Learning Objective Categories
Building a successful ML strategy requires balancing short-term product wins with long-term foundational advancements. You must categorize your goals to ensure you are not neglecting the infrastructure that supports future model iterations.
A balanced portfolio of objectives prevents the team from becoming a mere “feature factory” or a detached research lab.
Category 1: Product & User Impact
This category focuses on how your models change the experience of the end-user or the business customer. Objectives here are often shared with product teams to drive feature adoption, reduce user friction, or increase personalization.
Success is measured by metrics like retention lift, conversion rates, or the reduction of manual support tickets.
Category 2: Operational & System Excellence
These objectives prioritize the health, speed, and cost-effectiveness of your production machine learning systems. You focus on reducing inference latency, optimizing cloud spend, and building automated pipelines for data ingestion and training.
Excellence in this category ensures that your models are not only accurate but also scalable and reliable.
Category 3: Foundational & Research Advancement
This pillar addresses the long-term technical health and innovation capacity of your data science organization. It involves exploring new model architectures, reducing technical debt in the codebase, and improving the quality of your training data.
Foundational goals ensure that your team maintains a competitive advantage through continuous learning and state-of-the-art implementation.
Stop wasting compute on projects that don’t drive revenue and align your ML team with Synergita. Book your demo today to see how our modular platform drives strategic coherence.

Moving from these high-level categories to specific goals requires a disciplined approach to drafting your quarterly roadmap.
How to Write Effective Machine Learning OKRs: 3 Simple Steps
Writing effective goals for technical teams requires a deep understanding of the distinction between an output and an outcome. You must ensure that your team is not just shipping code, but actually solving a specific business problem.
Follow these steps to create a culture of high performance within your data science organization:
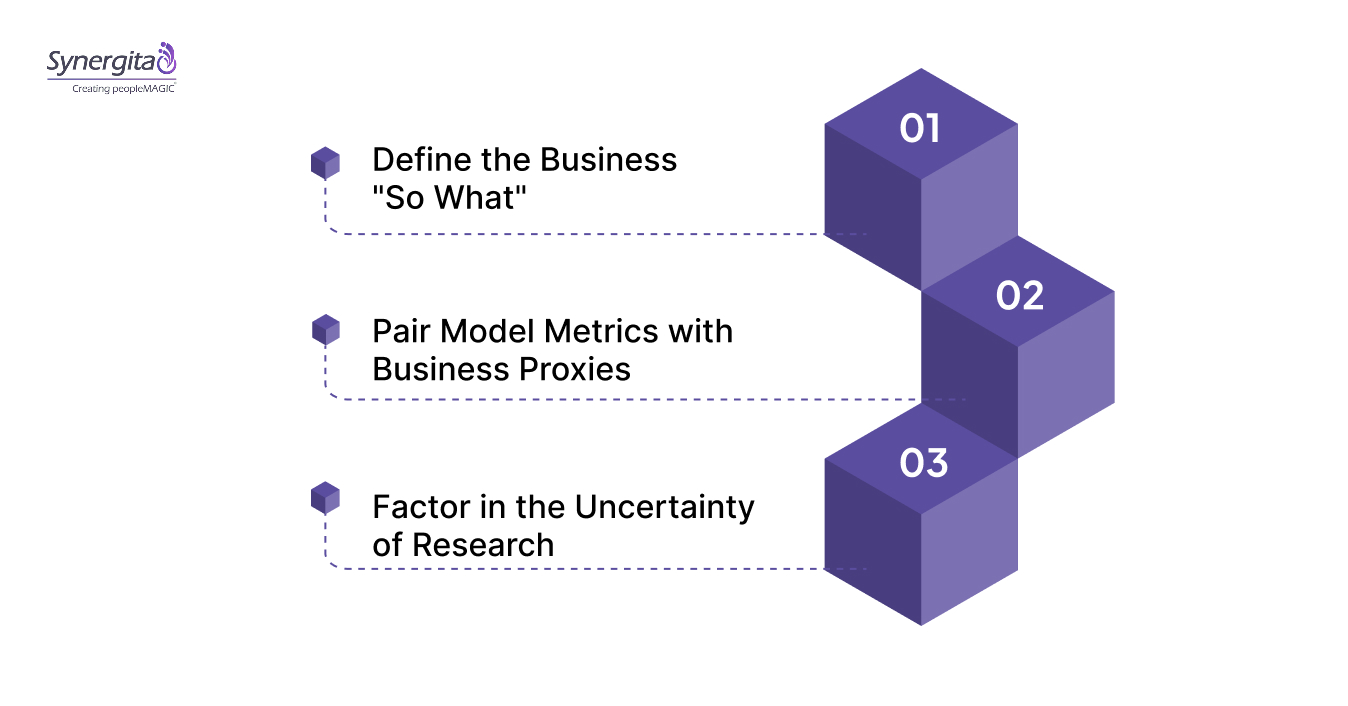
1. Define the Business “So What”
Before writing a technical objective, ask why this model improvement matters to the CEO or the customer. Your objective should be qualitative and inspiring, such as “Revolutionize the search experience for our mobile users.” Avoid starting with technical terms like “Improve our XGBoost parameters” as the primary goal.
2. Pair Model Metrics with Business Proxies
Every technical Key Result (KR) should have a corresponding business metric to ensure the model actually works. For example, if you increase model precision, you should also expect to see a reduction in manual review hours. This prevents the “Worshiping the Metric” trap, where a model performs well on paper but fails in reality.
3. Factor in the Uncertainty of Research
Machine learning experiments often fail, so your KRs should reflect the effort of discovery and the rigor of testing. Include results focused on the number of validated hypotheses or the successful completion of a robust A/B test. This encourages your team to be honest about results rather than chasing artificial targets.
Transitioning from a research-first mindset to a business-first mindset is easier with concrete examples to guide you.
Also read:How to Develop an Effective HR Strategy Framework
20 Proven OKR Examples for Machine Learning Teams
Translating strategy into execution requires a library of specific, data-backed examples that your team can adapt. The following tables provide a comprehensive playbook for setting goals that cover every aspect of the ML lifecycle.
These examples move beyond surface-level tasks to focus on the formulas that drive significant organizational value.
1. For Driving Product & User Impact
| Objective 1 | Key Results |
| Improve recommendation relevance to drive user engagement | 1. Increase Click-Through Rate (CTR) on “Recommended for You” from 5% to 8%. |
| 2. Lift average session duration by 15% through more relevant content. | |
| 3. Reduce the “Not Interested” feedback rate by 20% across the platform. |
| Objective 2 | Key Results |
| Personalize content to increase subscription retention | 1. Achieve a 10% reduction in churn for users with a personalization score above 80. |
| 2. Increase the conversion of free users to premium via AI-driven offers by 5%. | |
| 3. Drive a 20% increase in “New Discovery” saves per user per month. |
| Objective 3 | Key Results |
| Optimize search experience to reduce time-to-purchase | 1. Reduce average search-to-cart time from 4 minutes to 2 minutes. |
| 2. Decrease the “Zero Results” query rate by 30% through semantic search. | |
| 3. Increase search-driven revenue by 12% in the current quarter. |
| Objective 4 | Key Results |
| Automate support to enhance customer satisfaction | 1. Resolve 40% of tier-1 support tickets via the AI chatbot without human intervention. |
| 2. Maintain a CSAT score of 4.5/5 for AI-handled interactions. | |
| 3. Reduce average ticket response time by 50% through automated categorization. |
| Objective 5 | Key Results |
| Enhance ad targeting to maximize return on ad spend | 1. Increase conversion rate for targeted ads by 18%. |
| 2. Reduce cost-per-acquisition (CPA) by 10% through improved audience segmentation. | |
| 3. Achieve a 95% accuracy rate in demographic prediction for new users. |
| Objective 6 | Key Results |
| Reduce user churn through proactive intervention | 1. Identify 90% of churning users at least 14 days before their subscription ends. |
| 2. Increase the success rate of automated “win-back” campaigns by 15%. | |
| 3. Reduce involuntary churn due to payment failure by 5% using predictive retry logic. |
Also read:How to Improve Employee Performance: Effective Strategies
| Objective 7 | Key Results |
| Improve accessibility through automated captioning | 1. Achieve a 98% Word Error Rate (WER) accuracy for the top 5 languages. |
| 2. Increase the usage of accessibility features by 25% among targeted users. | |
| 3. Reduce manual caption correction hours by 60%. |
2. For Achieving Operational & System Excellence
| Objective 8 | Key Results |
| Reduce cloud inference costs to improve margins | 1. Decrease average cost per inference by 25% through model quantization. |
| 2. Reduce idle GPU hours by 40% via automated scaling policies. | |
| 3. Transition 100% of non-critical workloads to spot instances. |
| Objective 9 | Key Results |
| Improve model latency for a faster user experience | 1. Reduce p99 inference latency from 200ms to 50ms for the main model. |
| 2. Increase system throughput to handle 5,000 requests per second. | |
| 3. Achieve 99.99% uptime for the model serving infrastructure. |
| Objective 10 | Key Results |
| Automate manual data tasks to speed up development | 1. Reduce time spent on manual data labeling by 70% using active learning. |
| 2. Automate 100% of the ingestion pipeline for the new customer dataset. | |
| 3. Decrease the data prep-to-model-training window from 5 days to 1 day. |
| Objective 11 | Key Results |
| Increase fraud detection precision to save revenue | 1. Reduce the false positive rate in transaction monitoring from 2% to 0.5%. |
| 2. Identify and block $1M in fraudulent transactions before processing. | |
| 3. Maintain a detection latency of under 100ms for real-time blocking. |
| Objective 12 | Key Results |
| Optimize logistics to reduce delivery overhead | 1. Reduce total delivery distance by 8% through improved route optimization. |
| 2. Increase average vehicle load utilization from 75% to 85%. | |
| 3. Improve estimated time of arrival (ETA) accuracy by 20%. |
| Objective 13 | Key Results |
| Improve forecast accuracy for better inventory management | 1. Reduce Mean Absolute Percentage Error (MAPE) in sales forecasting by 10%. |
| 2. Decrease stock-out incidents in top-selling categories by 15%. | |
| 3. Reduce overstock inventory costs by 12% across all warehouses. |
| Objective 14 | Key Results |
| Ensure model reliability and ethical compliance | 1. Implement bias detection checks for 100% of production models. |
| 2. Achieve 0 critical vulnerabilities in the ML production codebase. | |
| 3. Reduce model drift incidents by 50% through real-time monitoring. |
3. For Building Foundational & Research Capability
| Objective 15 | Key Results |
| Deploy a new model architecture to production | 1. Successfully migrate 100% of traffic to the Transformer-based architecture. |
| 2. Achieve a 5% improvement in F1-score over the legacy baseline model. | |
| 3. Complete the deployment with 0 unscheduled system downtime. |
| Objective 16 | Key Results |
| Reduce technical debt in the ML codebase | 1. Increase unit test coverage for the training library from 40% to 80%. |
| 2. Refactor 3 core data pipelines to follow the new modular standard. | |
| 3. Reduce the average model retraining time by 40%. |
| Objective 17 | Key Results |
| Improve data pipeline quality and integrity | 1. Implement automated data validation checks for all ingestion sources. |
| 2. Reduce the number of data-related model failures to zero this quarter. | |
| 3. Increase the percentage of “clean” labeled data in the gold set by 20%. |
| Objective 18 | Key Results |
| Establish a robust model monitoring system | 1. Deploy real-time alerting for p99 latency and prediction drift. |
| 2. Create automated performance dashboards for 100% of live models. | |
| 3. Reduce time-to-detection for model failures from 4 hours to 10 minutes. |
| Objective 19 | Key Results |
| Reproduce a state-of-the-art paper for internal use | 1. Successfully match the paper’s benchmark accuracy on our internal dataset. |
| 2. Document the implementation and share findings with the wider R&D team. | |
| 3. Identify at least 2 potential product use cases for the new methodology. |
| Objective 20 | Key Results |
| Build a new internal tool or library for the team | 1. Launch the internal “Feature Store” with 10+ shared features. |
| 2. Onboard 100% of the data science team to the new experiment tracker. | |
| 3. Reduce the time to set up a new experiment environment by 50%. |
Aligning these technical tasks with business outcomes is the first step toward a high-performance ML culture. Book a demo with Synergita to discover how our platform can help you manage complex technical OKRs.

Knowing these mistakes in advance allows you to build guardrails for success.
Top 5 OKR Traps for ML Teams and How to Escape Them
Technical teams often face unique challenges when adopting a goal-setting framework designed for broader business use. Without careful planning, your OKRs can unintentionally encourage bad behaviors or obscure the actual progress of your research.
Recognizing these traps early allows you to build a more resilient and transparent organizational culture.
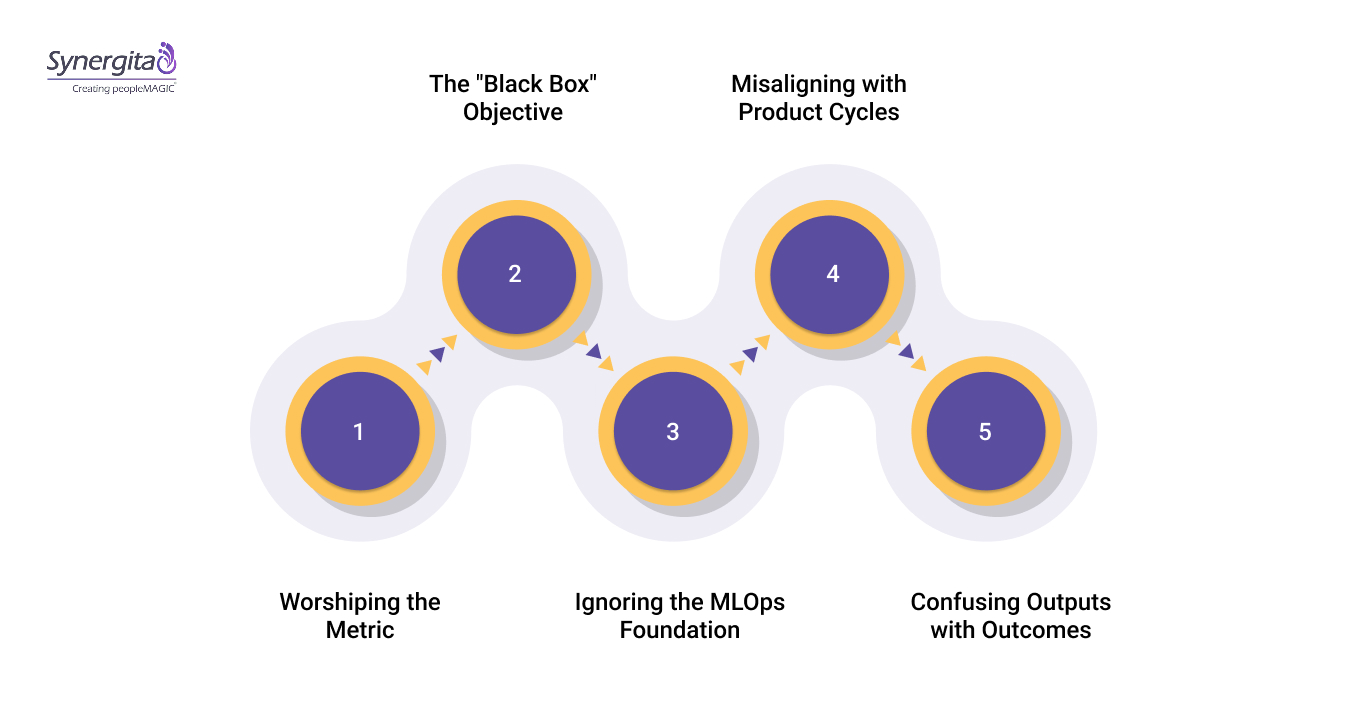
Trap 1: Worshiping the Metric
This happens when a team over-optimizes for a single KPI, like accuracy, while ignoring the negative side effects on the user. For example, a recommendation engine might increase clicks by showing sensationalist content that harms the brand long-term.
How to avoid:
- Pair every technical KR with a “counter-metric” or a business quality metric.
- Regularly review the qualitative impact of model changes on the user experience.
- Ensure your objectives prioritize long-term value over short-term numerical wins.
Trap 2: The “Black Box” Objective
Setting goals that are impossible to attribute to the ML model’s direct impact creates confusion during the grading process. If “Total Company Revenue” is your only metric, you cannot prove that your model was the primary driver of that change.
How to avoid:
- Use controlled A/B testing as the primary way to measure the key result of a model change.
- Focus on metrics that the ML team can directly influence, such as “in-app conversion” or “churn prediction accuracy.”
- Document the specific link between technical performance and business outcomes in your planning.
Trap 3: Ignoring the MLOps Foundation
Teams often set ambitious product OKRs without having the production infrastructure to support rapid iteration or reliable deployment. This leads to models that perform well in notebooks but take months to reach the actual end-user.
How to avoid:
- Always include at least one “Operational Excellence” objective in every quarterly cycle.
- Prioritize investments in automated testing and monitoring before launching new architectures.
- Treat infrastructure work as a first-class citizen rather than an afterthought to research.
Trap 4: Misaligning with Product Cycles
ML research often takes longer than a standard three-month product sprint, leading to “unmet” OKRs that discourage the team. If your quarterly goals require a research breakthrough that takes six months, the framework will feel like a burden.
How to avoid:
- Break down long-term research goals into smaller, measurable milestones for each quarter.
- Coordinate planning with product managers to ensure model delivery aligns with feature launches.
- Use “learning objectives” for the discovery phase of a project to maintain momentum.
Trap 5: Confusing Outputs with Outcomes
Celebrating a launched model is an output, but measuring the actual business change it created is the outcome. Many teams consider their work finished once the model is in production, regardless of whether it actually solved the user’s problem.
How to avoid:
- Ensure your KRs focus on post-launch performance rather than just the deployment date.
- Require a “post-mortem” analysis of every model launch to evaluate its business impact.
- Reward teams based on the measurable value they create for the organization.
Correcting these strategic errors sets the stage for adopting the advanced techniques used by high-performing data science organizations.
Also read:Effective OKR Examples for Teams and Businesses
Best Practices for Effective OKR Implementation
Sustaining a high-performance ML culture requires more than just a good template; it requires a commitment to radical transparency. Your goal-setting process must be visible to everyone, from the data engineers to the executive leadership team.
This openness creates a sense of shared ownership that is vital for surviving the long cycles of experimental research.
1. Foster Cross-Functional Collaboration
Data science does not happen in a vacuum, so ensure your objectives are co-authored with product and engineering stakeholders. This ensures that the technical requirements and business needs are aligned from the start of the quarter.
How it helps:
- Eliminates departmental silos and conflicting priorities.
- Speeds up the integration of models into the final product.
- Increases the overall visibility of the ML team’s impact.
2. Standardize Your Review Rhythms
Establish a predictable schedule for planning, grading, and resetting your goals to create a consistent organizational heartbeat. This rhythm prevents goal-setting from feeling like a special event and makes it a standard part of your operations.
How it helps:
- Automates strategic focus across the entire organization.
- Reduces administrative friction during the transition between quarters.
- Ensures continuous improvement of both models and processes.
3. Celebrate Learning and Hypothesis Validation
In a field as uncertain as AI, validating that a specific approach does not work is often as valuable as a success. Create a culture where “failing” a key result provides valuable data that informs the next strategic cycle.
How it helps:
- Reduces the fear of failure and encourages innovative research.
- Improves the accuracy of future capacity planning and goal setting.
- Refines the team’s ability to identify high-potential technical avenues.
Also read:How to Make Better Strategic Decisions in 2025: Process, Tools & Examples
Notebooks and isolated project management tools cannot provide the cross-functional alignment and strategic visibility you need.
Synergita: Connecting Technical Milestones to Strategic Success
Managing complex machine learning OKRs in static spreadsheets often leads to fragmented data and a lack of real-time visibility. Technical leaders find themselves spending more time chasing progress updates than actually guiding their teams through difficult research challenges.
You need a unified platform that can handle the nuance of technical goals while maintaining high-level strategic alignment.
Synergita provides a modular, cloud-based solution that specifically addresses the needs of high-growth technical organizations. Our platform consolidates your goal tracking, continuous feedback, and performance analytics into a single source of truth.
- Lightweight OKR Module: Deploy your strategic framework across data science and engineering teams in days.
- Continuous Check-ins: Facilitate meaningful 1:1 conversations that keep researchers aligned with business missions.
- AI-Powered Analytics: Access distraction-free insights into project health and model trajectories through configurable dashboards.
- Perform Plus Module: Automate the entire promotion lifecycle and digital appraisal letter distribution for your top-performing engineers.
By unifying your talent and goal management, you can ensure that every model your team builds is a business win.
Conclusion
OKRs provide the essential framework for transforming machine learning work from isolated technical projects into drivers of measurable business value. They create focus on outcomes, alignment with product and company goals, and a clear method for demonstrating ROI.
The 20 examples and structured framework in this guide offer a complete blueprint for implementation. A dedicated platform like Synergita is critical for executing this strategy at scale without managerial overhead. It turns strategic goals into visible, aligned actions for data scientists and engineers.
Book your demo with Synergita to see how a unified platform can operationalize this transformation for your ML team.
FAQs
Q. What is a good OKR for a machine learning team?
A good ML OKR has a clear business-oriented Objective and measurable Key Results. Example: O: Improve the efficiency of our customer support. KRs: 1) Deflect 25% of tier-1 tickets using a new NLP classifier. 2) Achieve a customer satisfaction score of 4.5/5 on chatbot resolutions. 3) Reduce average support cost per ticket by 15%.
Q. How are OKRs different from standard ML project metrics?
Standard ML metrics (accuracy, F1-score, and latency) measure the health and performance of the model itself. OKRs are a goal-setting framework that uses those technical metrics as inputs to achieve a business outcome, like increased revenue or reduced cost. OKRs define why you are optimizing the model.
Q. How often should machine learning teams review their OKRs?
ML OKRs should follow a quarterly cycle for setting strategic goals. However, progress should be reviewed bi-weekly in sync with agile sprint reviews, and experiment progress should be discussed weekly. This matches the iterative nature of ML development.
Q. Should OKRs be used to evaluate individual data scientist performance?
Best practice is to separate them. Use team or project OKRs to align work and measure collective impact. Evaluate individual performance based on their contribution to the OKRs, technical skill growth, and collaboration, not solely on whether a stretch business metric was hit.
Q. What’s the first step in implementing OKRs for an existing ML team?
Start with a retrospective. Analyze 1-2 recent projects that were considered “successful.” Map what was delivered (the model) versus what business impact was actually measured and proven. Use this gap to build the case for outcome-focused OKRs in the next planning cycle.