
You currently justify HR investments with anecdotal evidence rather than concrete data. This approach makes budget approvals and executive influence challenging for your department. The data gap prevents you from proving HR’s return on investment.
Your talent strategy needs quantitative proof to guide organizational decisions effectively. You must transition from transactional operations to a data-driven partnership. Demonstrate HR’s value through numbers that connect people management to profitability.
This guide delivers a consultant’s framework for tracking essential HR metrics. We define critical measurements and precise tracking methods for strategic advantage. Transform your HR function into an evidence-based strategic powerhouse.
At A Glance
- HR metrics are essential for proving the ROI of talent initiatives and gaining C-suite influence.
- Focus on metrics across four crucial categories: Talent Acquisition, Performance, Retention, and Operational Cost.
- Quality of Hire and Revenue Per Employee are leading indicators of business health.
- You must integrate your HR systems to eliminate data silos and ensure accuracy for reporting.
- Absenteeism and Early Turnover signal cultural and management issues that demand immediate intervention.
What Are HR Metrics?
HR metrics are quantitative measurements used to track, monitor, and analyze human capital and organizational effectiveness. These quantifiable data points provide objective insights into the productivity, engagement, and costs associated with your workforce.
Metrics transform subjective observations about employees into verifiable, reliable business data for decision-making purposes. They allow HR leaders to benchmark performance, predict trends, and calculate the financial impact of people strategies.
Strategic HR functions rely on these precise measurements to ensure alignment with overall corporate goals.
Understanding the definition is insufficient; you must grasp the strategic necessity behind using these metrics.
Importance Of HR Metrics
Using clear HR metrics allows you to transcend the administrative function and assume a strategic leadership role within your organization. Data-backed decision-making replaces guesswork, allowing you to proactively address risks and capitalize on opportunities.
Strategic use of metrics proves the financial necessity of talent investments to the executive team. This shift ensures your human resources strategy is viewed as a vital contributor to business success and not just an overhead cost.
Here is why utilizing a robust metric framework is fundamental:
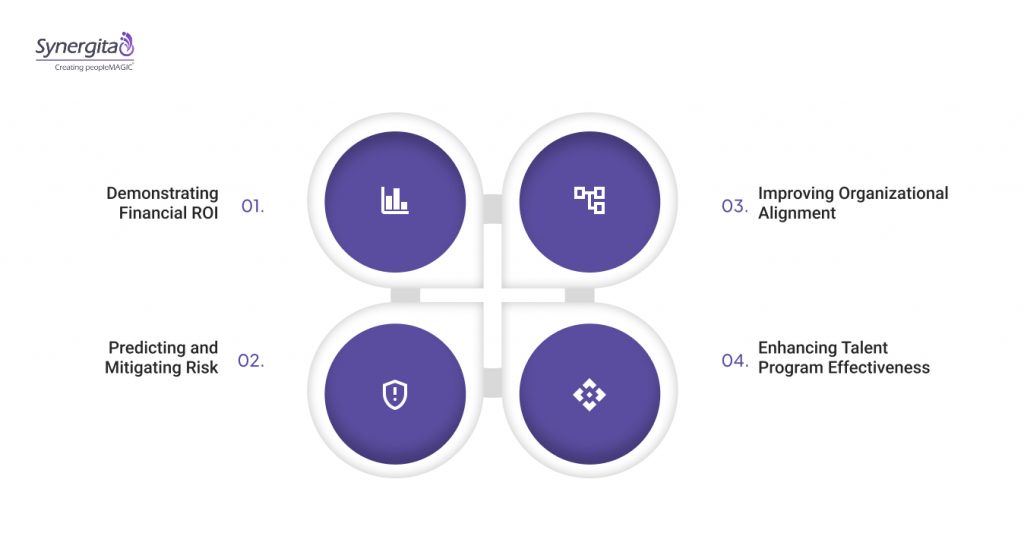
1. Demonstrating Financial ROI
Metrics enable you to calculate the precise return on investment for initiatives like training programs or recruitment technology. You can move beyond stating that training is good and instead prove that it resulted in a measurable increase in revenue per employee. This evidence is crucial for securing budget and executive approval for future HR projects.
2. Predicting and Mitigating Risk
Tracking metrics like voluntary turnover and absenteeism provides early warning signs of cultural or management failures that threaten stability. You can predict future staffing crises or poor performance trends before they cause significant business disruption. Proactive data analysis allows you to implement targeted interventions precisely where they are needed most.
3. Improving Organizational Alignment
Metrics like company performance and revenue per employee connect HR activities directly to the organization’s overarching financial health and strategic objectives. This provides a common language for discussing talent and ensuring HR priorities are inextricably linked to company success. It solidifies HR’s place as a critical business partner.
4. Enhancing Talent Program Effectiveness
Metrics provide objective feedback on the success and failure points of your specific HR programs, such as onboarding or performance appraisals. You can analyze the training completion rate versus job performance to determine program effectiveness and mandate continuous improvement.
Also Read:5 Ways to Get a better handle on Team Dynamics
Now that the strategic imperative is clear, we must define the precise metrics required for this level of analysis.
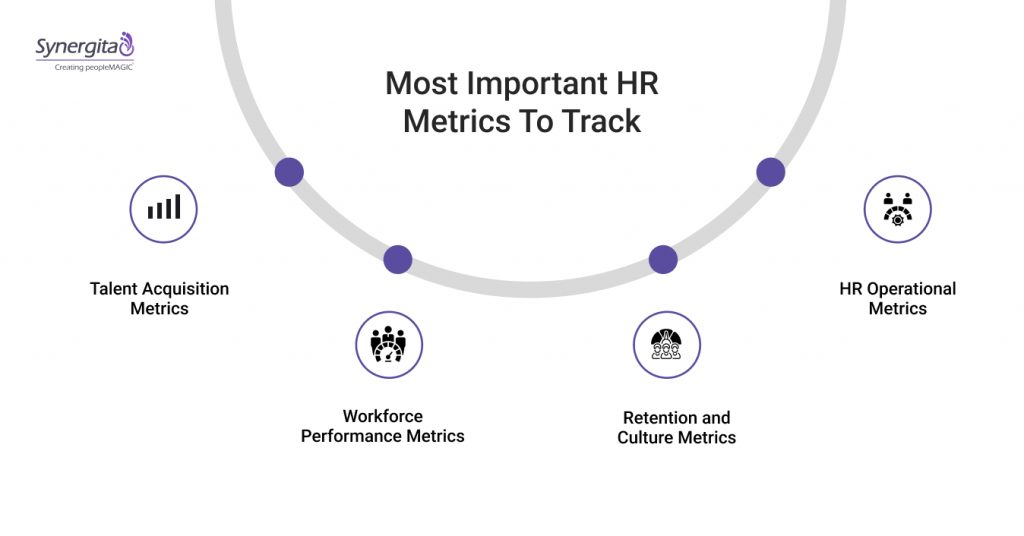
15 Most Important HR Metrics To Track
The sheer volume of available data requires you to focus on high-impact metrics across core HR functions. We categorize these metrics into four main groups: Talent Acquisition, Workforce Performance, Retention and Culture, and HR Operational Efficiency.
Focusing on these categories ensures a comprehensive, strategically valuable overview of your human capital health. This targeted approach prevents data overload and ensures you prioritize the most relevant indicators.
Here are the key HR metrics to track for strategic HR management:
1. Talent Acquisition Metrics
These metrics gauge the speed, quality, and cost efficiency of your hiring process, signaling recruiting bottlenecks or successes:
1. Time to Hire
This metric measures the number of days between the job opening being approved and the successful candidate accepting the offer. A shorter time to hire indicates an efficient process and reduces the duration a position impacts productivity. It directly affects the speed at which the business can meet its staffing needs.
How to track:
- Measure the total days from the job requisition creation date to the candidate offer acceptance date.
- Segment the data by job role, department, and hiring manager to identify process inefficiencies.
- Use your Applicant Tracking System (ATS) data to automate this calculation for consistency.
2. Cost Per Hire
This is the total financial expense incurred to recruit one new employee, including all internal and external costs. Analyzing this metric reveals the financial efficiency of your various sourcing channels and recruitment team overhead. Controlling this cost ensures recruiting investments are profitable.
How to track:
- Sum all internal costs (staff salaries, interviewer time) and external costs (ads, agency fees, tech).
- Divide the total cost by the total number of hires made during the defined period.
- Track cost per hire by role seniority to benchmark against industry standards.
3. Quality of Hire
This metric assesses the value a new employee brings to the organization, usually measured by performance ratings and early tenure success. It is arguably the most critical recruiting metric as it directly links hiring effectiveness to business outcomes. A high-quality hire validates your entire acquisition strategy.
How to track:
- Calculate the average first-year performance rating for all new hires in a given period.
- Incorporate early turnover rate and first-year manager feedback into a weighted average score.
- Correlate this score with the hiring source to prove which channels deliver the best talent.
4. Acceptance Rate
This metric measures the percentage of candidates who accept a formal job offer extended by the organization. A low acceptance rate signals problems with compensation competitiveness, offer presentation, or employment brand perception. It reveals the market’s reception to your hiring efforts.
How to track:
- Divide the number of accepted offers by the total number of offers extended in a given period.
- Analyze acceptance rates segmented by department, salary range, and job level for deeper insights.
- Correlate changes in the rate with economic changes or specific offer components.
Also Read:How Employee Feedback Loops Increase Employee Retention
2. Workforce Performance Metrics:
These metrics link employee output and training efforts directly to organizational success, verifying talent quality and development ROI:
1. Employee Performance
This involves using formal appraisal scores and continuous feedback to quantify an individual’s contribution toward organizational goals and objectives. This data feeds into talent calibration and succession planning. It is the key output measure of your human capital investment.
How to track:
- Collect and normalize formal performance review scores across all departments and rating scales.
- Integrate performance data with OKR achievement rates for a more holistic view of impact.
- Use Synergita’s Analytics Module to visualize performance distribution (e.g., 9-box matrix).
2. Revenue Per Employee
This high-level financial metric measures how much revenue is generated by the average full-time equivalent (FTE) employee. It is a critical measure of workforce efficiency and overall productivity. Tracking this shows the C-suite the direct economic value of the people function.
How to track:
- Divide the total company revenue for a period by the average number of FTEs during that period.
- Trend this metric over time and compare it with industry peers to gauge relative efficiency.
- Segment this metric by high-performing vs. low-performing teams to identify operational excellence.
3. Training Effectiveness
This metric measures how well a training program translates into actual skill development and on-the-job behavioral changes. Tracking effectiveness ensures that training budget allocations provide genuine value to the business. It proves that learning investments are delivering a positive return.
How to track:
- Compare pre-training competency scores against post-training scores using skills assessments.
- Link training completion rate directly to post-training changes in employee performance metrics.
- Collect post-training supervisor feedback on the observable behavioral changes in the trainee.
4. Absenteeism
This metric tracks the percentage of scheduled work time employees miss due to unapproved or unscheduled absences. High absenteeism signals low morale, potential burnout, or poor job fit, creating immediate productivity drag. It is an urgent indicator of internal health issues.
How to track:
- Calculate lost working days due to unscheduled absences divided by total available working days.
- Track this metric by department, shift, or manager to identify specific problem areas requiring intervention.
- Distinguish between different types of absenteeism to understand underlying causes.

3. Retention and Culture Metrics
These metrics assess the stability of your workforce and the health of your organizational culture, highlighting turnover risks:
1. Voluntary Turnover Rate
This measures the percentage of employees who willingly leave the organization over a specific period, signaling dissatisfaction with the job, manager, or culture. This is the most crucial stability metric because voluntary departures are often preventable. High rates indicate a toxic environment or poor management.
How to track:
- Divide the number of voluntary separations by the average number of employees during the period.
- Analyze turnover segmented by tenure, manager, and department to pinpoint specific flight risks.
- Use exit interview data to understand the underlying causes driving employee decisions.
2. Early Turnover
This focuses specifically on employees who leave the company within their first year of employment, often indicating failures in the hiring or onboarding process. High early turnover destroys recruiting ROI and damages organizational culture. It signals a failure in initial integration.
How to track:
- Measure the percentage of new hires who leave voluntarily within 12 months of their start date.
- Correlate this rate with the Quality of Hire metric to confirm if poor hiring is the root cause.
- Use the data to refine the onboarding content and first 90-day manager checkpoints.
3. Retention Rate
This metric measures the percentage of employees who remain with the organization over a specific period, providing the inverse view of turnover. A high retention rate demonstrates organizational stability and the effectiveness of engagement strategies. When employees feel both their leader and the overall organisation are empathetic, they want to stay longer (+3 years). This makes retention rate a powerful measure of employee loyalty and a positive cultural environment.
How to track:
- Divide the number of employees remaining at the end of the period by the number at the start, minus new hires.
- Track retention rate per manager to identify high-performing leaders who excel at developing and keeping talent.
- Segment the retention rate by high-potential groups to ensure future leadership stability.
4. Employee Satisfaction
This measures the level of contentment employees feel with their job, workplace, and overall organizational experience, often via surveys. It acts as a leading indicator of future retention and engagement. High satisfaction correlates with lower absenteeism and higher productivity.
How to track:
- Conduct regular Pulse Surveys or Annual Employee Engagement Surveys to gather quantitative data.
- Track Net Promoter Score (eNPS) as a simple measure of employee willingness to recommend the workplace.
- Correlate satisfaction scores with manager performance ratings to prove management impact.
5. HR Operational Metrics
These metrics track the internal efficiency and financial cost of the HR department itself, demonstrating administrative effectiveness:
1. HR to Employee Ratio
This metric measures the number of HR staff per 100 or 1,000 employees in the organization. It assesses whether the HR department is appropriately staffed to service the workforce size. A balanced ratio indicates efficient resource allocation.
How to track:
- Divide the total number of FTE employees in the organization by the total number of HR FTE staff.
- Benchmark the resulting ratio against industry and size peer group data for comparative analysis.
- Use this to justify the need for new HR technology over additional administrative headcount.
2. Cost of HR Per Employee
This calculation totals all HR departmental expenses and distributes that cost across the entire workforce. This is a critical metric for HR leaders to manage their own budget efficiency. Lowering this cost through automation demonstrates fiscal responsibility.
How to track:
- Sum all HR operating expenses, including salaries, technology, facilities, and training.
- Divide the total HR cost by the average number of employees during the period.
- Track this metric over time to prove the cost savings delivered by new HR software implementations.
3. Effectiveness of HR Software
This assesses the extent to which HR technology is utilized by employees and managers and whether it achieves its intended goal of simplifying processes. Poor utilization means the investment is not delivering full value. It measures the ROI of your tech stack.
How to track:
- Track user adoption rates and login frequency for key HR software modules (e.g., performance).
- Measure the time spent by HR staff on previously manual administrative tasks versus post-implementation.
- Conduct brief manager surveys on the perceived ease of use for goal setting or feedback submission.
Merely collecting these metrics is insufficient; generating high-impact strategic intelligence requires rigorous adherence to best practices.
Need to automate your HR metrics tracking? Synergita unifies performance, OKR and people analytics. Book a demo to explore our integrated metrics dashboard.
Best Practices To Track Key HR Metrics
Collecting the right data is only the starting point; generating actionable intelligence requires discipline and rigor in your approach. Strategic HR leaders apply consistent best practices to ensure their metrics are accurate, relevant, and influential.
Poor data governance renders any metric unreliable and reduces executive trust. You must establish a standard operating procedure for metric collection and reporting.
Here are the best practices for robust HR metric tracking:
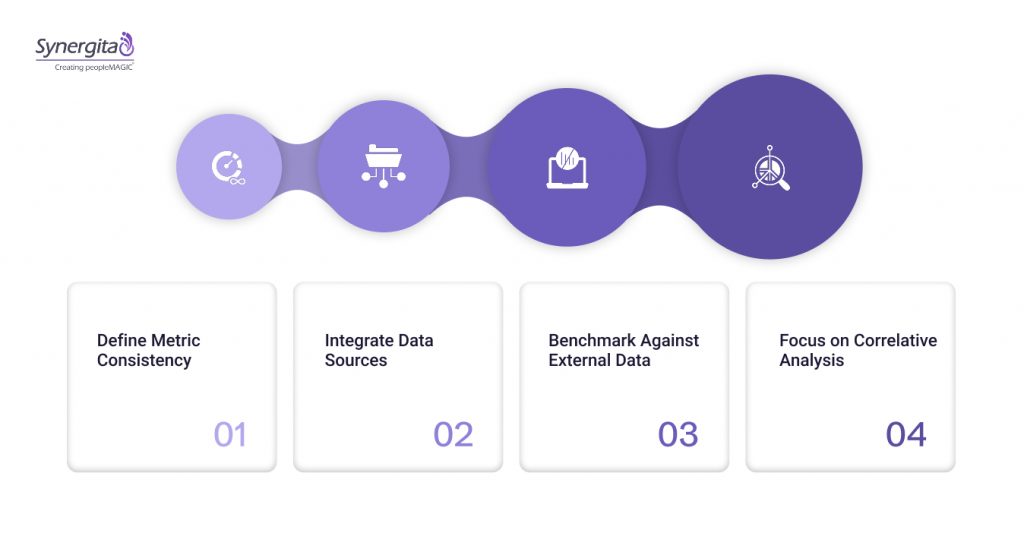
1. Define Metric Consistency
Establish a strict, centralized definition for every single metric to ensure uniform calculation across departments and time periods. For instance, define exactly what constitutes an ‘active employee’ or ‘recruiting cost’ for all reporting. This consistency prevents ambiguity and ensures data integrity across the board.
2. Integrate Data Sources
Ensure all HR systems (ATS, HRIS, Performance Management) communicate seamlessly to eliminate manual data aggregation and reduce errors. Data silos inherently produce inconsistent reporting and severely slow down strategic analysis. Use a unified platform like Synergita to link performance and goal data automatically.
3. Benchmark Against External Data
Measure your internal metrics against relevant external industry peers or best-in-class organizations to provide essential context. Knowing your voluntary turnover rate is 15% is only meaningful if you know the industry average is 8% or 20%. External benchmarking turns a number into a compelling strategic narrative.
4. Focus on Correlative Analysis
Do not just report metrics in isolation; analyze the relationship between different data points to find actionable insights. For example, correlate your training effectiveness with your early turnover rate to see if insufficient training drives new hires to quit. Correlative analysis reveals the root cause of complex talent issues.
Also Read:Tips to Build Trust in the New Normal with Regular One-on-One Meetings and Check-ins
Even the most disciplined HR teams will encounter common obstacles that must be proactively mitigated to maintain data integrity.
Common Challenges For Tracking Key HR Metrics
Even with a defined strategy, HR teams encounter predictable obstacles that impede effective metric tracking and strategic analysis. These challenges typically stem from technological limitations or a lack of organizational commitment to data governance.
Ignoring these issues severely restricts HR’s ability to prove value and influence business strategy. Addressing these limitations is a precondition for becoming a data-driven department.
Be prepared to mitigate these common challenges in metric tracking:
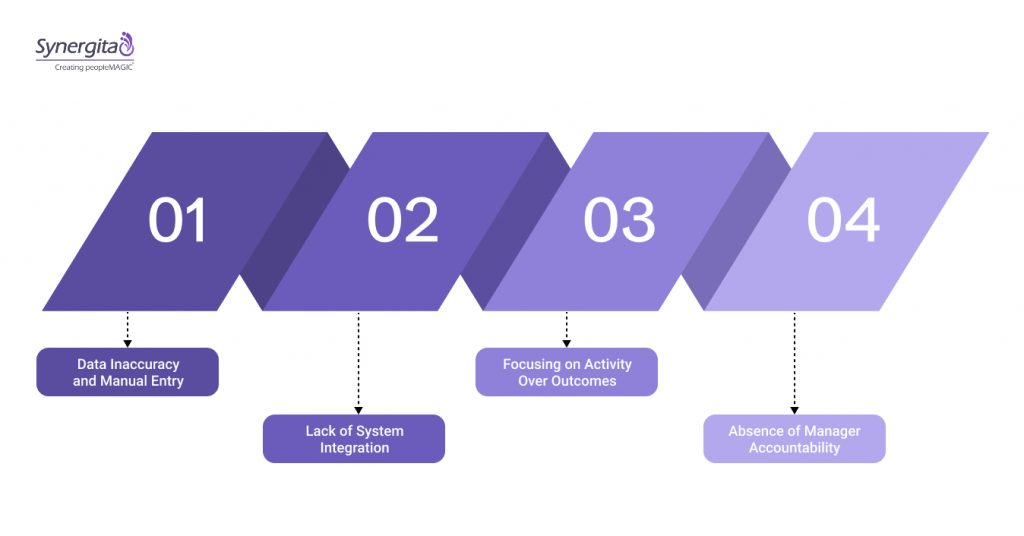
1. Data Inaccuracy and Manual Entry
Relying heavily on spreadsheets or manual data collection introduces inevitable errors, creating mistrust in the final metric reports. Inaccurate data leads to flawed strategic recommendations and a damaging loss of credibility with leadership. Manual processes are simply unsustainable at scale.
2. Lack of System Integration
Operating with multiple disconnected HR software systems makes compiling comprehensive, accurate reports cumbersome and time-consuming. Data retrieval becomes a major administrative burden, preventing real-time strategic analysis. Siloed data prevents a holistic view of the employee lifecycle.
Ready to move from spreadsheets to strategic insights? Synergita delivers real-time HR metrics without manual work. Book a demo to see our configurable analytics in action.
3. Focusing on Activity Over Outcomes
Tracking simple administrative output metrics like ‘number of training sessions held’ instead of outcome metrics like ‘training effectiveness’ offers little strategic value. Activity-based metrics confirm compliance but fail to prove business impact or inform future strategy. Outcome metrics are required for strategic influence.
4. Absence of Manager Accountability
Metrics tracking relies on timely and accurate input from managers, such as performance ratings or goal updates, which is often inconsistent. If managers are not held accountable for using the HR system properly, the data quality suffers dramatically. Poor data input compromises the entire strategic framework.
Also Read:Why Continuous Feedback is Important to Predict Employee Attrition
Addressing these data challenges manually is neither sustainable nor scalable; a unified technology platform is the only viable solution.

Focus On Strategic HR Decision Making With Synergita
HR data sits trapped in disconnected systems. Manual reporting delays prevent real-time insights. This fragmentation blocks strategic workforce decisions. Synergita unifies OKR, performance and analytics in one platform.
We eliminate data silos to create a single source of truth. This transforms HR into a strategic intelligence function. The Synergita platform delivers specific capabilities crucial for strategic metric tracking:
- Configurable Dashboards and Analytics: Provides real-time visibility into metrics like the 9-Box Grid, performance cycles, and turnover trends.
- Integrated Performance Management: Links individual and team performance scores directly to strategic goals (OKRs) for accurate Employee Performance tracking.
- Core HR (People Profile): Centralizes all employee data, providing the foundation for accurate calculations like HR to Employee Ratio and Cost of HR Per Employee.
- 360° Feedback and Continuous Check-ins: Gathers rich data for Employee Satisfaction and Retention Rate per Manager.
- Administration Module: Allows HR to define and manage consistent rating scales and metric calculations across the entire organization.
Stop reconciling spreadsheets and start influencing strategy with trusted, real-time people data from a unified platform.
Conclusion
Tracking the right HR metrics provides the evidence needed for strategic people decisions. It connects human resource management to business performance and outcomes. This discipline elevates HR’s organizational influence and impact.
Moving from manual tracking to integrated analytics requires the right technological foundation. Synergita delivers this capability through automated, AI-powered people analytics. Our platform makes advanced metrics accessible without specialized resources.
Book a demo to see how Synergita’s analytics module transforms your HR metrics into business intelligence.
FAQs
Q. What is the difference between leading and lagging HR metrics?
Leading metrics predict future outcomes, such as Employee Satisfaction predicting future turnover. Lagging metrics report past results, like the Voluntary Turnover Rate itself. Strategic HR focuses primarily on influencing the leading indicators.
Q. Which metric best reflects workforce productivity?
Revenue Per Employee is arguably the best single metric for overall workforce productivity, as it directly connects human capital to financial output. For internal team efficiency, look at output linked to goal completion.
Q. How often should we review our core HR metrics?
Critical operational metrics like Absenteeism and Time to Hire should be reviewed at least monthly. Strategic metrics like Quality of Hire and Retention Rate should be reviewed quarterly to observe trends.
Q. Why is Quality of Hire difficult to track accurately?
It is complex because it requires combining multiple objective inputs, such as performance ratings, goal achievement, and manager feedback, over a full year. A dedicated performance management system is required for consistent measurement.
Q. Should we track all the listed metrics simultaneously?
Start by focusing on 6-8 high-impact metrics across all four categories that directly address your current top business priorities. Avoid the common mistake of tracking too many metrics, which leads to data overwhelm and diluted focus.