
Is your HR team drowning in raw employee data without generating true business insight? You meticulously collect mountains of information on hiring, performance, and turnover.
However, if this data merely sits in spreadsheets, you are operating on intuition, not evidence. This approach leaves critical talent decisions vulnerable to guesswork and costly errors, slowing strategic business growth.
The absence of actionable intelligence is a significant operational handicap for modern HR leadership. You need to move beyond simple data storage to create a proactive, predictive function.
Companies utilizing advanced analytics have reported a 25% increase in business productivity and a 50% reduction in attrition rates. This demonstrates the tangible impact of transforming raw metrics into strategic foresight.
This comprehensive guide breaks down the framework for world-class HR analytics and reporting. We will explore essential metrics, analytical types, and best practices. You will learn to establish an HR function that drives measurable business outcomes.
Key Takeaways
- Move from descriptive to predictive: Shift from reporting what happened to forecasting future workforce trends and prescribing actions.
- Focus on business-impact metrics: Prioritize measurements like revenue per employee and voluntary turnover that directly affect organizational performance.
- Establish data governance first: Ensure data quality and security before building complex analytical models.
- Connect analytics to decisions: Every analysis should conclude with specific, actionable recommendations for leaders.
- Start with clear business questions: Begin each analytical project by addressing a critical organizational challenge or opportunity.
- Build analytical storytelling capability: Present findings visually with clear explanations of business implications.
What Is HR Analytics And Reporting
HR data capabilities should move beyond basic administrative record-keeping. They must serve as a critical intelligence arm for the entire organization. This distinction separates a reactive HR department from a strategic business partner.
This is where HR analytics and reporting come into the picture. Here’s what you need to know about it:
What is HR Analytics
HR analytics is the systematic process of gathering, analyzing, and interpreting HR data. It identifies relationships and patterns within workforce data sets. The aim is to understand thoroughly how people’s processes affect the business goals.
This method uses statistical models to answer forward-looking questions about your workforce strategy. HR analytics transforms information into organizational foresight and competitive advantage.
What is HR Reporting
HR reporting is the process of generating accurate, standardized summaries of current and historical workforce data. It focuses on presenting key operational metrics and statistics.
The purpose is to provide clarity on the current state of the organization’s people functions. Reporting addresses the question of “What happened?” by creating dashboards and regular summaries.
Understanding these definitions is only the first step; the true value lies in the substantial business benefits you can unlock.
Also read: AI and Machine Learning in HR: Smarter Hiring, Stronger Teams
Benefits Of HR Analytics And Reporting
Shifting to a data-driven HR function creates measurable improvements across the entire employee lifecycle. Your strategic decisions are no longer based on feelings but on verifiable facts. This level of evidence increases HR’s credibility at the executive level.
Organizations use these insights to enhance talent acquisition and reduce operational costs. The analytical process reveals hidden inefficiencies in core HR workflows. By understanding the data, you can directly influence profitability and organizational stability.
The strategic advantages extend beyond basic metrics:
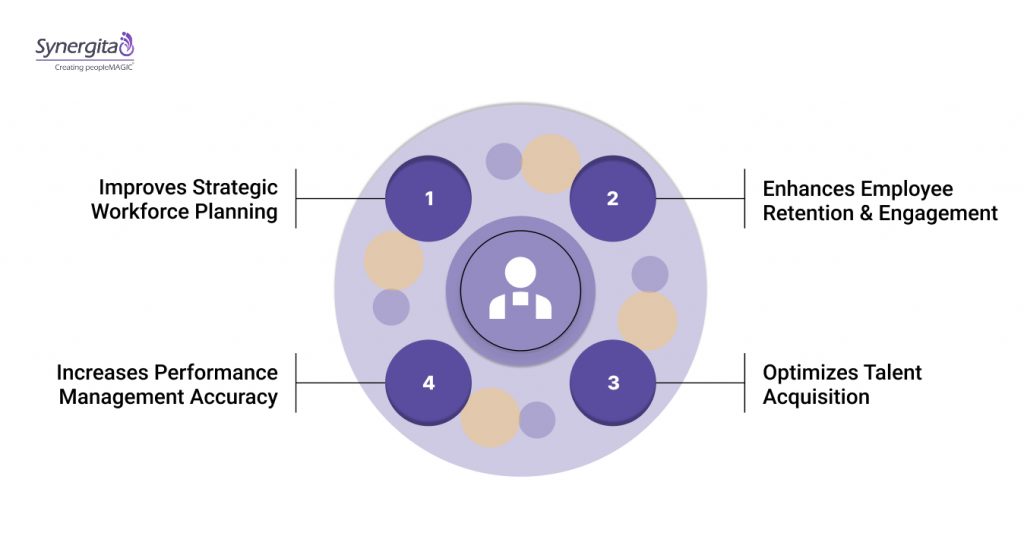
1. Improves Strategic Workforce Planning
Data provides foresight into future talent gaps and skill requirements. This allows for proactive planning rather than reactive hiring later on. It ensures your workforce composition aligns with long-term business objectives.
2. Enhances Employee Retention and Engagement
Analyzing turnover data identifies key flight risks among high performers. You can develop targeted interventions, such as better training or compensation. This significantly reduces the business cost associated with unwanted attrition.
3. Optimizes Talent Acquisition
Analytics pinpoints the most effective and cost-efficient sourcing channels. It helps you shorten the time-to-hire for critical roles. This ensures you attract and secure top talent faster than the competition.
4. Increases Performance Management Accuracy
Objective data replaces subjective bias in performance evaluations and promotions. It links individual performance to measurable Key Results and organizational success. This fosters a culture of transparent, fair, and high-accountability performance.
Moving from abstract benefits to concrete results requires mastering the underlying processes for both reporting and analytics.
HR Analytics And Reporting: How It Works?
Implementing a successful data strategy involves distinct processes for reporting versus analytics. Reporting is a standardized function, while analytics requires deeper, investigative work. Both rely on clean, reliable data inputs from your Core HR system.
HR Reporting: How it works
The reporting process is focused on data extraction, aggregation, and presentation for operational oversight.
- Collecting Raw Data: Data is extracted from your HRIS, payroll, and performance systems. This initial step requires strict data governance standards for quality.
- Structuring and Standardizing: The collected raw data is cleaned and standardized across all defined metrics. This ensures consistent calculations for every department and time period.
- Generating Visual Summaries: Reports are produced as standardized dashboards or scheduled operational summaries. These visuals track operational status, such as headcount and sick leave trends.
HR Analytics: How it works
The analytical process is an iterative investigation focused on explaining and predicting workforce behavior.
- Framing the Business Question: Begin with a high-value question such as, “What causes high performers to leave within two years?” This guides the entire analytical effort.
- Developing and Testing Hypotheses: Analysts use statistical techniques like regression to test potential data relationships. They search for correlations between variables, like training investment and performance scores.
- Communicating Actionable Insights: The final step delivers the answer and the recommendation to HR and business leaders. This insight dictates specific, evidence-based strategy changes, such as modifying the training curriculum.
Identify which HR metrics actually drive business outcomes. Use our diagnostic framework to assess your current analytical maturity and pinpoint improvement areas. Book a free demo now.
With these core processes defined, we can now examine the specific, high-stakes scenarios where reports are indispensable.
Also read: Are You Tracking the Right Metrics for Employee Retention in 2025?
What Are HR Reports Used For
HR reports provide the foundational data necessary for executive decision-making and legal compliance. They act as the verifiable ledger for all people-related operations. These reports move beyond simple counts to provide context for high-level business discussions.
Key uses ensure organizational transparency and regulatory adherence. They also inform budget allocations for critical HR functions. Reports are essential for demonstrating the health and stability of your workforce.
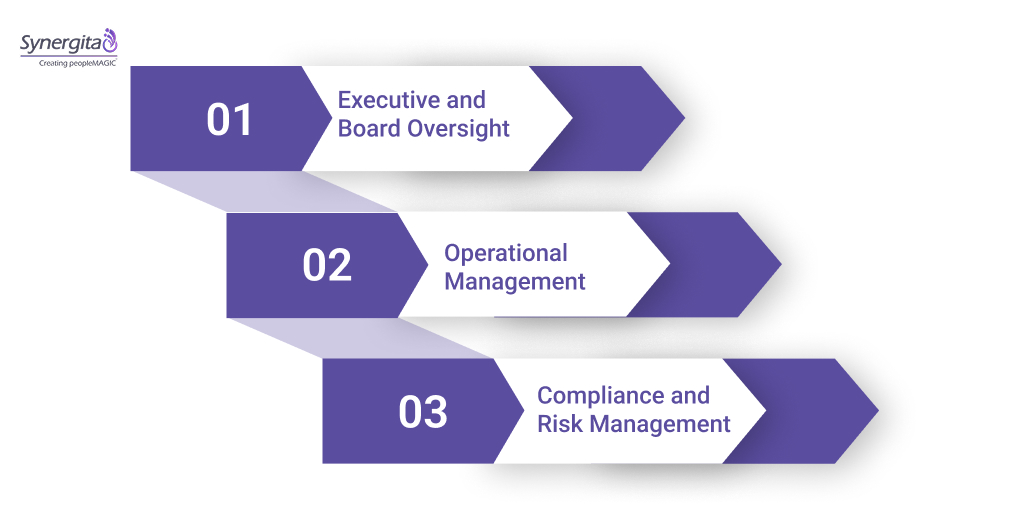
1. Executive and Board Oversight
Reports provide key summary metrics like headcount changes and cost of labor. This informs the board and executive team about the organization’s human capital status. These summaries are vital for quarterly business reviews and investor briefings.
2. Operational Management
Daily or weekly reports track critical administrative metrics, such as time-off requests or payroll errors. They enable managers to monitor team health and maintain workflow continuity. This ensures routine operations run smoothly without costly interruptions.
3. Compliance and Risk Management
Standardized reports ensure adherence to labor laws and internal policies. Data on diversity, equity, and inclusion are crucial for mandatory legal reporting. They also proactively identify potential areas of legal risk or internal policy violations.

What metrics does HR analytics measure?
Strategic HR analytics focuses on metrics that directly correlate with financial performance and operational excellence. Moving beyond activity measures, you must track metrics that reflect business impact. These data points provide the evidence needed to secure investment for new HR initiatives.
Prioritizing these strategic metrics demonstrates HR’s value as a profit-driver, not merely a cost center. They link people processes, like training, directly to organizational productivity. This shift elevates HR to the status of a fully business-aligned function.
1. Revenue per Employee
This measures the average amount of revenue generated by each full-time employee. It is a fundamental metric for assessing overall workforce productivity and efficiency. An increase suggests successful talent acquisition and development strategies.
2. Time to Hire
This tracks the number of calendar days between a job being approved and the candidate accepting the offer. A shorter time-to-hire indicates an efficient recruitment process and quicker filling of critical roles. This reduces lost productivity due to open positions.
3. Absenteeism Rate
This is the percentage of unscheduled employee absences over a given period. High rates often signal underlying issues with workload, engagement, or workplace culture. Reducing absenteeism directly improves operational efficiency and reduces labor costs.
4. Voluntary Turnover Rate
This measures the percentage of employees who choose to leave the organization. High voluntary turnover, especially among high performers, signals a severe talent retention problem. Analyzing the root cause is critical for long-term stability.
Also read: Lattice vs Culture Amp: Which HR Platform Fits Your Team in 2025?
5. Involuntary Turnover Rate
This is the percentage of employees dismissed by the organization due to performance or conduct issues. A carefully managed rate indicates effective hiring and performance management processes. A high rate suggests poor upfront screening or training.
6. Offer Acceptance Rate
This is the percentage of candidates who accept a formal job offer. A high rate suggests competitive compensation, a strong employer brand, and positive candidate experience. It validates the effectiveness of your overall talent acquisition strategy.
7. Time to Fill
This tracks the number of working days required to fill a specific position. Time to fill measures operational efficiency from a vacancy’s creation to the new hire’s start date. This metric helps forecast recruitment capacity needs.
8. Training Efficiency
This metric assesses the effectiveness of training programs by linking investment to measurable performance improvement. It involves comparing post-training performance data to baseline metrics. It ensures that training spending delivers a tangible return on investment.
9. Training Expenses per Employee
This calculates the total annual training cost divided by the total number of employees. Monitoring this metric helps control talent development expenditure. You can ensure equitable resource allocation across the workforce.
While these metrics provide the what, structuring your data into targeted reports is necessary for effective communication across the organization.
Types Of HR Reporting
Reporting provides foundational visibility, organized into distinct categories based on their purpose and frequency. These reporting types ensure comprehensive coverage of all HR operations. They offer various perspectives, from daily tactical needs to annual strategic summaries.
Each report type serves a specific audience and decision-making need within the organization. Defining these categories clarifies the communication of people’s data. This ensures that the right information reaches the right leaders at the right time.
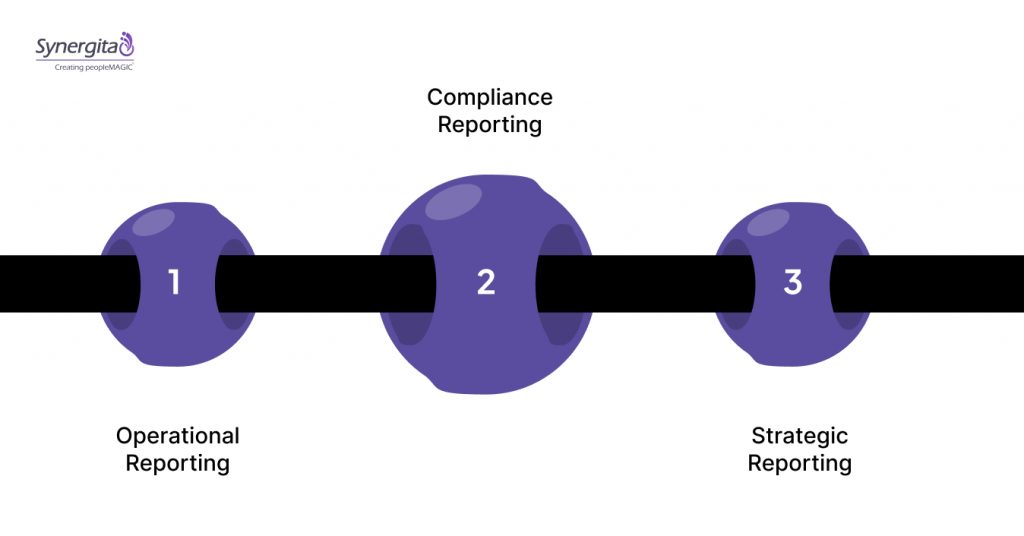
1. Operational Reporting
This focuses on routine, day-to-day administrative metrics and functions. It includes data on headcount, attendance, leaves, and recruitment funnel status. These reports ensure immediate, timely oversight of ongoing HR processes.
- How it works: Operational reporting involves generating high-volume, frequently updated reports directly from transactional HR systems. It uses simple aggregation and filtering to show the current status of HR workflows. Examples include daily sick leave summaries or weekly hiring metrics.
- Pros and Cons:
- Pros: Provides immediate process visibility, supports day-to-day decision-making, and is straightforward to produce.
- Cons: Lacks strategic context, can be overwhelming if too detailed, and focuses only on efficiency, not impact.
2. Compliance Reporting
These reports are specifically designed to meet regulatory and legal obligations. They cover data such as mandatory EEO, diversity, and safety reporting. Accuracy in compliance reporting mitigates significant legal and financial risk.
- How it works: This involves extracting specific, predefined data points to match external governmental or industry standards. The report formats are often rigid and mandated by law, requiring meticulous data collection and auditing. Its core function is to prove adherence to external rules.
- Pros and Cons:
- Pros: Essential for mitigating legal penalties, demonstrates organizational responsibility, and is mandatory for operation.
- Cons: Does not offer business insight, data requirements can be complex to meet, and it is purely backward-looking.
3. Strategic Reporting
These reports provide C-suite level summaries of HR’s impact on business goals. They often aggregate data on turnover cost, performance distribution, and workforce readiness. Strategic reports support long-range organizational planning and investment decisions.
- How it works: Strategic reports require combining data from multiple sources (e.g., HRIS and finance) to create a business context. They use visual summaries like dashboards and 9-box grids for executive consumption. The reports are typically reviewed quarterly or annually for planning.
- Pros and Cons:
- Pros: Directly informs business strategy, links HR activities to financial outcomes, and increases HR’s executive influence.
- Cons: Requires data from non-HR systems, can be subjective without analytical backing, and needs careful interpretation.
Beyond reporting the status, a strategic HR function must employ increasingly sophisticated analytical techniques to gain true foresight.
Also read: OKR Review Frequency Best Practices 2026: Don’t Let Q1 Slip
Types Of HR Analytics
HR analytics is structured into four progressive types, moving from historical explanation to future-focused action. Climbing this hierarchy allows HR to shift from simply documenting the past to actively designing the future. Each level builds upon the insights of the previous one.
Mastering these four types transforms HR from a support function into a strategic, predictive business partner. The ultimate goal is to reach the prescriptive stage, where your system suggests the optimal course of action. This defines a truly data-driven talent strategy.
1. Descriptive Analytics
Descriptive analytics is the most fundamental type, focusing on answering: What happened? It summarizes past and current workforce data using key metrics. These analyses provide a clear picture of the current state and historical trends.
- How it works: Descriptive analytics uses simple arithmetic, averages, and counts to report facts. It creates dashboards showing headcount, average tenure, or total training hours completed. This is the starting point for all deeper analytical work.
- Pros and Cons:
- Pros: Easy to understand, provides a necessary operational baseline, and clearly defines the present situation.
- Cons: Cannot explain why something happened, offers no predictive power, and limits strategic action.
2. Diagnostic Analytics
Diagnostic analytics moves beyond reporting facts to answer: Why did it happen? It investigates the root causes of observed trends or anomalies. This type of analysis requires deeper dives using correlation and data mining techniques.
- How it works: It involves techniques like drill-down, data discovery, and statistical correlation analysis. This might link a rise in turnover (the what) to a specific change in management structure (the why). It identifies the driving factors behind key HR outcomes.
- Pros and Cons:
- Pros: Pinpoints specific problem areas, validates initial hypotheses, and provides the foundation for corrective action.
- Cons: Requires clean, integrated data sets, can be time-consuming, and still only explains past events.
3. Predictive Analytics
Predictive analytics employs statistical models to anticipate future results, answering: What is likely to happen? This type of analysis uses historical data patterns to estimate probabilities. A common use is identifying high-performing flight risk.
- How it works: This level employs machine learning, time-series analysis, and regression models. It might predict which employees are 70% likely to leave in the next 12 months based on their compensation and team changes. It provides a strategic head start on future workforce challenges.
- Pros and Cons:
- Pros: Enables proactive decision-making, quantifies future risks, and directly supports strategic workforce planning.
- Cons: Predictions are never 100% accurate, require complex algorithms, and demand significant computational resources.
4. Prescriptive Analytics
Prescriptive analytics is the highest level, answering: What should we do about it? It recommends specific, optimal courses of action based on the predicted outcomes. This analysis uses optimization techniques to guide decision-making.
- How it works: It uses simulation and optimization algorithms to weigh various intervention options. It could recommend the exact percentage raise needed to reduce a specific high-performer’s flight risk below 20%. It dictates the best organizational strategy.
- Pros and Cons:
- Pros: Provides the highest business value, automates complex decision-making, and delivers optimized solutions.
- Cons: Highly dependent on the accuracy of predictive models, it is the most complex to implement, and requires strong system integration.
Compare your current metrics against live platform data. Book a demo to see real-time HR analytics dashboards in action.
Achieving success with these advanced analytical types requires adopting rigorous standards and a focused operational mindset.
Also read: Effective OKR Examples for Teams and Businesses
Best Practices For HR Analytics And Reporting
A successful data strategy requires moving beyond tool acquisition to focus on organizational rigor and focus. Your efforts must be business-aligned, secure, and easily consumable by decision-makers. Adhering to these principles maximizes the return on your data investment.
Adopt these practices to build credibility and ensure long-term utility from your analytical function. The emphasis must always remain on providing actionable insight, not just data dumps. This consultative approach is what executive leadership values most.
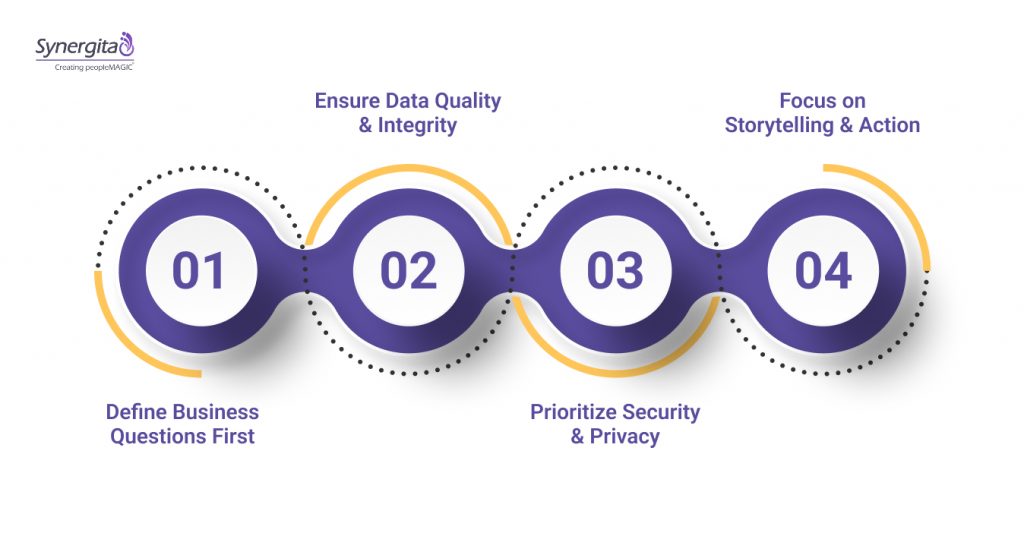
1. Define Business Questions First
Always start by addressing a critical business need, not just generating random reports. Focus on high-impact issues like reducing sales staff turnover or improving product development efficiency. This ensures direct relevance and adoption by leadership.
2. Ensure Data Quality and Integrity
Inaccurate or inconsistent data will destroy the credibility of your findings immediately. Establish clear protocols for data entry, storage, and cross-system validation. Reliable data is the absolute foundation for all analytics.
3. Prioritize Security and Privacy
Workforce data is highly sensitive and requires stringent security and access controls. Ensure all data handling complies with local and international privacy regulations. Maintaining employee trust is non-negotiable for a functioning HR system.
4. Focus on Storytelling and Action
Raw data is not insight; the interpretation and recommendation are the value. Present findings visually, clearly explaining the business implications of the data. Always conclude with a precise, actionable recommendation for leaders.
Applying these best practices often highlights the limits of disconnected tools and manual data processes within organizations.
From Data To Insight: The Synergita Approach
Many organizations struggle with disconnected data sources and manual processes. HR teams spend more time compiling reports than generating insights. This creates analysis paralysis instead of actionable intelligence.
Synergita transforms this challenge into a strategic advantage. Our integrated platform automatically consolidates and analyzes people data. This provides ready-to-use insights for evidence-based decisions.
The platform delivers these specific capabilities:
- Pre-built Analytics Dashboards: Access standardized reports for common HR metrics with one click, eliminating manual data compilation and ensuring consistency.
- Custom Report Builder: Create tailored analyses using drag-and-drop functionality without technical expertise, addressing specific business questions.
- Real-time OKR Tracking: Monitor goal progress and alignment across the organization, connecting individual contributions to business outcomes.
- Predictive Turnover Modeling: Identify flight risks and retention opportunities using AI-powered algorithms, enabling proactive intervention.
This integrated approach transforms raw data into strategic workforce intelligence that drives business performance.
Also read: Best Tools for OKR Management and Visualization
Conclusion
HR analytics and reporting provide the foundation for evidence-based people management. They transform subjective perceptions into objective insights about workforce dynamics. This discipline elevates HR from an administrative function to a strategic partner.
Moving from basic reporting to predictive analytics requires the right technological infrastructure. Synergita delivers this capability through integrated, AI-powered people analytics. Our platform makes advanced insights accessible without specialized expertise.
Schedule a demonstration to see how Synergita can transform your people data into a competitive advantage.
FAQs
Q. What is the difference between HR analytics and HR reporting?
HR reporting describes what has happened with historical data summaries. HR analytics explains why it happened and predicts what might occur next. Reporting provides the foundation for analytical insights.
Q. What are the four types of HR analytics?
Descriptive analytics summarizes what has occurred historically. Diagnostic analytics examines why events happened. Predictive analytics forecasts future probabilities. Prescriptive analytics recommends specific optimal actions.
Q. How do you measure HR analytics?
Measure analytical effectiveness through business impact metrics. Track improvements in retention, productivity, and hiring quality. Connect people analytics to operational and financial outcomes.
Q. What are the pillars of HR analytics?
Data quality forms the foundational pillar. Analytical technology enables processing capability. Skilled practitioners interpret and apply insights. Business alignment ensures relevance and adoption.
Q. Which HR metrics are most important?
Focus on metrics that connect to business outcomes. Voluntary turnover, revenue per employee, and time to productivity typically deliver the greatest insights. Select measurements based on organizational priorities.
Q. How can small companies start with HR analytics?
Begin with basic data collection and standardized reports. Focus on three to five critical metrics aligned with business goals. Use available tools before investing in specialized platforms.