
Operational bottlenecks often remain invisible until they cause a significant financial loss or a drop in customer satisfaction scores. You likely see teams working harder while output remains stagnant or quality declines across various departments.
This friction occurs because most organizations measure activity levels instead of focusing on the actual outcomes of their workflows. Traditional management styles focus on completing tasks rather than identifying the systemic waste that slows down your entire organization.
Without a structured goal-setting method, process changes often feel like temporary fixes rather than permanent strategic upgrades. You need a way to quantify how a smoother operation directly results in higher margins and better employee engagement.
This guide provides a practical blueprint for using OKRs for process improvement. You will find actionable examples and a method to track them effectively.
At A Glance
- Process improvement OKRs must measure outcomes, not just project completion.
- Effective OKRs fall into three categories: Efficiency, Quality, and Agility.
- Use leading indicators (like cycle time) and lagging indicators (like cost savings) together.
- Avoid the trap of improving one team’s process at the expense of another.
- Sustained improvement requires OKRs for user adoption and change management.
- A dedicated platform like Synergita ensures company-wide alignment on these goals.
Importance of OKRs for Process Improvement
Process improvement requires a high degree of transparency and a willingness to challenge established organizational norms. A structured framework provides the necessary clarity for teams to take risks and experiment with new ways of working.
This discipline ensures that your best talent focuses on solving high-stakes systemic issues rather than repetitive manual work.
Implementing a formal system provides several strategic advantages for maintaining a competitive edge in your industry:
- Predictable Scaling: Standardizing your workflows allows you to project growth more accurately based on proven throughput and capacity data.
- Enhanced Accountability: Clearly defined key results eliminate the ambiguity surrounding who owns the success of a specific internal workflow.
- Resource Optimization: Identifying and removing redundant steps frees up your capital and human resources for more innovative business tasks.
- Agile Adaptability: Short quarterly cycles allow your team to pivot processes quickly in response to shifting market demands or disruptions.
Establishing these benefits allows your leadership team to move from reactive troubleshooting to proactive organizational design and growth.
Also read: Top Objectives of Employee Engagement

How to Write Effective OKRs for Process Improvement
Drafting effective goals requires a deep understanding of the difference between a qualitative aspiration and a quantitative yardstick. Your objective should define the “what” in an inspiring way, while key results provide the “how” through numbers.
This dual approach keeps your team motivated while remaining strictly anchored to the reality of your operational data.
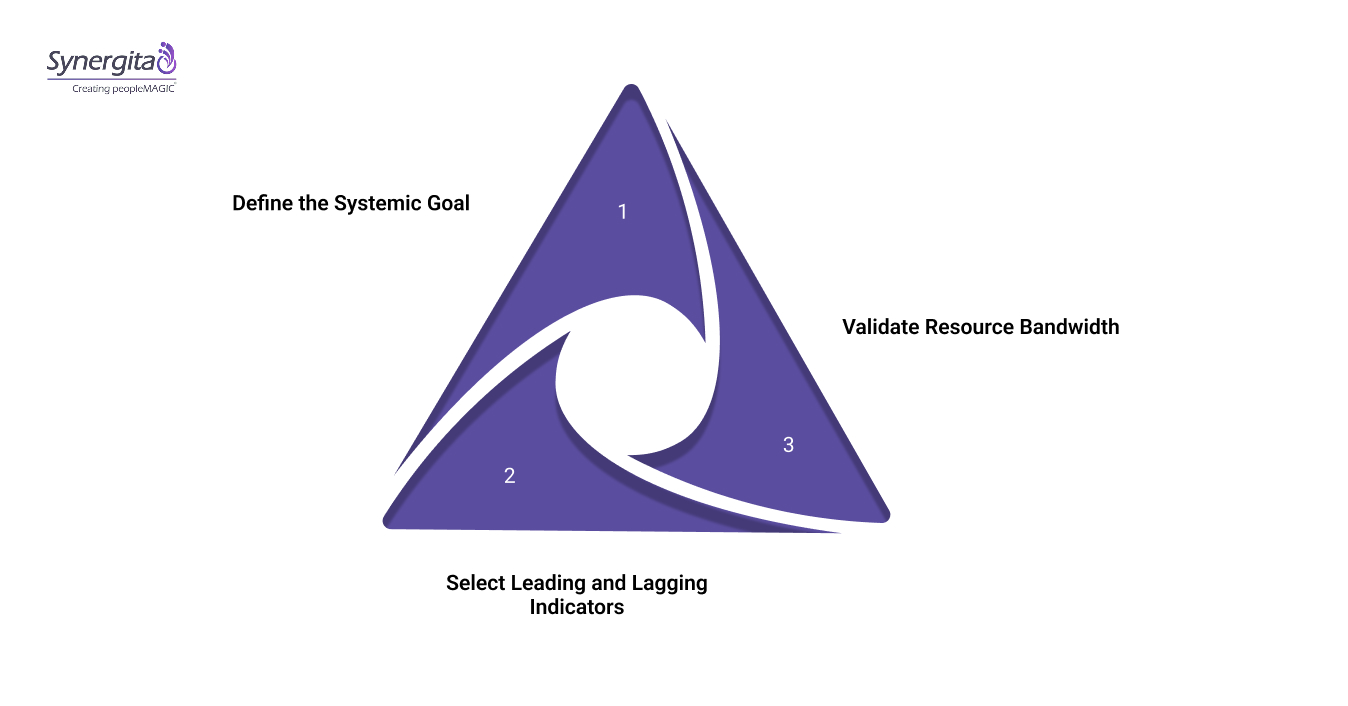
1. Define the Systemic Goal
Identify one qualitative aspiration that addresses your most urgent operational pain point for the next ninety days. Your objective should be ambitious enough to spark passion but realistic enough to be achieved within the timeframe.
Focus on the human or business impact of the change rather than using overly technical or abstract jargon.
2. Select Leading and Lagging Indicators
For every objective, choose three specific metrics that prove the process is actually becoming more efficient or reliable. Use a mix of leading indicators like “cycle time” and lagging indicators like “total cost savings” for balance. If a result cannot be measured with a hard number, it is likely a task, not a key result.
3. Validate Resource Bandwidth
Review your proposed goals against your current team capacity and budget to ensure they are achievable without causing burnout. You must identify which current activities will be paused to make room for the new improvement initiatives you set.
Failing to account for capacity often leads to the total collapse of the goal-setting system across the team.
Leaders who connect these strategic dots effectively often find that a unified platform simplifies the entire management cycle. Book your demo with Synergita to see how our modular platform helps you visualize these goal trajectories in real time.
Moving from theory to practice requires seeing how these principles apply to specific operational pillars within your organization.
Three Core Process Improvement Objective Categories
Successful process improvement is not a monolithic task but a combination of efficiency, quality, and organizational responsiveness. You must categorize your objectives to ensure you are not sacrificing long-term reliability for short-term speed gains.
This framework helps your team identify which specific lever they need to pull to achieve the desired outcome.
Consider these three critical categories when planning your next quarterly cycle:
Category 1: Efficiency & Productivity
This category focuses on maximizing your output while minimizing the resources, time, or capital required for a specific task. You look at metrics like cycle time, throughput, and cost per unit to identify where waste is currently occurring.
Objectives here aim to streamline workflows and remove the non-value-added steps that slow down your production or service delivery.
Category 2: Quality & Reliability
These objectives prioritize the accuracy and consistency of your outputs to ensure that you meet or exceed customer expectations. You measure success through error rates, defect density, and the frequency of customer complaints related to your internal processes.
High quality reduces the need for expensive rework and builds long-term trust with both internal and external stakeholders.
Category 3: Agility & Responsiveness
This pillar addresses how quickly your organization can adapt to changes or fulfill requests from your target market. You focus on lead time, changeover time, and on-time delivery rates to gauge your ability to stay competitive.
An agile process allows you to capitalize on new opportunities faster than competitors who are slowed by rigid systems.
A strong framework is only as good as the actionable examples you use to guide your specific teams.
15 Proven OKR Examples for Process Improvement Teams
Translating strategy into execution requires seeing how these principles look in a practical, day-to-day business environment. The following tables provide a comprehensive playbook for setting objectives across different operational departments and strategic initiatives.
Use these examples as a starting point to build your own strategic roadmap for the coming four quarters:
1. Efficiency and Productivity Examples
| Objective 1 | Key Results |
| Streamline the employee onboarding process | 1. Reduce time-to-productivity for new hires from 45 days to 30 days. |
| 2. Automate 100% of the hardware provisioning workflow through the IT portal. | |
| 3. Achieve a 90% satisfaction score from new hires on the onboarding experience. |
| Objective 2 | Key Results |
| Optimize cloud infrastructure costs | 1. Reduce monthly cloud spend by 15% through instance right-sizing. |
| 2. Automate the shutdown of non-production environments during off-hours. | |
| 3. Achieve 100% tag compliance for all cloud resources for better tracking. |
| Objective 3 | Key Results |
| Maximize the output of the content production team | 1. Increase weekly blog post output from 3 to 5 articles. |
| 2. Reduce the average review cycle time from 4 days to 2 days. | |
| 3. Achieve 100% adherence to the updated SEO content brief template. |
| Objective 4 | Key Results |
| Improve the efficiency of the internal help desk | 1. Reduce the average ticket resolution time from 8 hours to 4 hours. |
| 2. Increase the percentage of tickets resolved on first contact to 75%. | |
| 3. Reduce the volume of “password reset” tickets by 40% via self-service. |
| Objective 5 | Key Results |
| Refine the sales-to-success handoff process | 1. Reduce the time from contract signature to kickoff call to 48 hours. |
| 2. Achieve 100% completion of the pre-kickoff discovery document by sales. | |
| 3. Maintain a 4.8/5 rating from CS managers on the quality of handoffs. |
2. Quality and Reliability Examples
| Objective 6 | Key Results |
| Enhance the reliability of our production deployments | 1. Reduce the change failure rate from 10% to under 2%. |
| 2. Decrease the Mean Time to Recovery (MTTR) from 60 minutes to 15 minutes. | |
| 3. Achieve 100% automated test coverage for all critical path features. |
| Objective 7 | Key Results |
| Improve the accuracy of financial reporting | 1. Reduce the number of post-close adjustments by 50% this quarter. |
| 2. Close the monthly books within 4 business days consistently. | |
| 3. Achieve zero critical errors in the quarterly internal audit review. |
Also read: How to Give Constructive Feedback to Employees
| Objective 8 | Key Results |
| Strengthen the quality of customer data in the CRM | 1. Reduce duplicate lead records by 30% through automated cleansing. |
| 2. Ensure 100% of “Active” accounts have a verified contact person listed. | |
| 3. Update 100% of stale lead records older than six months. |
| Objective 9 | Key Results |
| Enhance the consistency of product documentation | 1. Achieve 100% coverage of new features in the user knowledge base. |
| 2. Reduce “documentation-related” support tickets by 20%. | |
| 3. Maintain an 85% “Helpful” rating on all public-facing API docs. |
| Objective 10 | Key Results |
| Minimize production defects in the software lifecycle | 1. Reduce the number of critical bugs reported by users by 40%. |
| 2. Increase the ratio of automated to manual tests from 1:1 to 3:1. | |
| 3. Achieve a 95% pass rate on all pre-release security scans. |
3. Agility and Responsiveness Examples
| Objective 11 | Key Results |
| Accelerate the software development lifecycle | 1. Increase the weekly deployment frequency from 2 to 5 releases. |
| 2. Reduce the average lead time for new features from 14 days to 7 days. | |
| 3. Automate 100% of the staging environment deployment process. |
| Objective 12 | Key Results |
| Improve the responsiveness of the recruiting team | 1. Reduce the average time-to-hire from 40 days to 25 days. |
| 2. Decrease the time between the initial screen and first interview to 3 days. | |
| 3. Achieve a 90% acceptance rate on all extended job offers. |
| Objective 13 | Key Results |
| Enhance the agility of marketing campaign launches | 1. Reduce the campaign brief-to-launch time from 3 weeks to 1 week. |
| 2. Automate the tracking of 100% of marketing links via a centralized tool. | |
| 3. Increase the number of concurrent A/B tests per month from 2 to 6. |
| Objective 14 | Key Results |
| Speed up the legal review process for sales contracts | 1. Reduce the average contract turnaround time from 5 days to 2 days. |
| 2. Implement 3 standardized contract templates to cover 80% of deals. | |
| 3. Achieve a 100% adoption rate of the new e-signature platform. |
| Objective 15 | Key Results |
| Improve the agility of internal procurement requests | 1. Reduce the average purchase order approval time by 50%. |
| 2. Ensure 100% of vendors are onboarded through the new digital portal. | |
| 3. Achieve a 20% reduction in “rush order” processing costs. |
Establishing a disciplined approach to these goals ensures that your team stays focused on meaningful outcomes. Explore Synergita’s OKR module to see how we help teams like yours manage these objectives without adding administrative overhead. Book a demo to learn more.

Maintaining this level of focus requires recognizing and avoiding the subtle mistakes that can sabotage your progress.
Also read: Logistics OKR Examples: 15 Best Objectives And Key Results
5 Common OKR Mistakes Process Improvement Teams Make
Implementing a new framework often reveals deep-seated cultural habits that can derail your operational progress if left unaddressed. Many teams treat these goals as a static document rather than a dynamic management tool that informs daily decisions.
Recognizing these common pitfalls early allows you to build a more resilient and transparent organizational culture.
Avoid these strategic errors to ensure your efforts lead to actual business value:
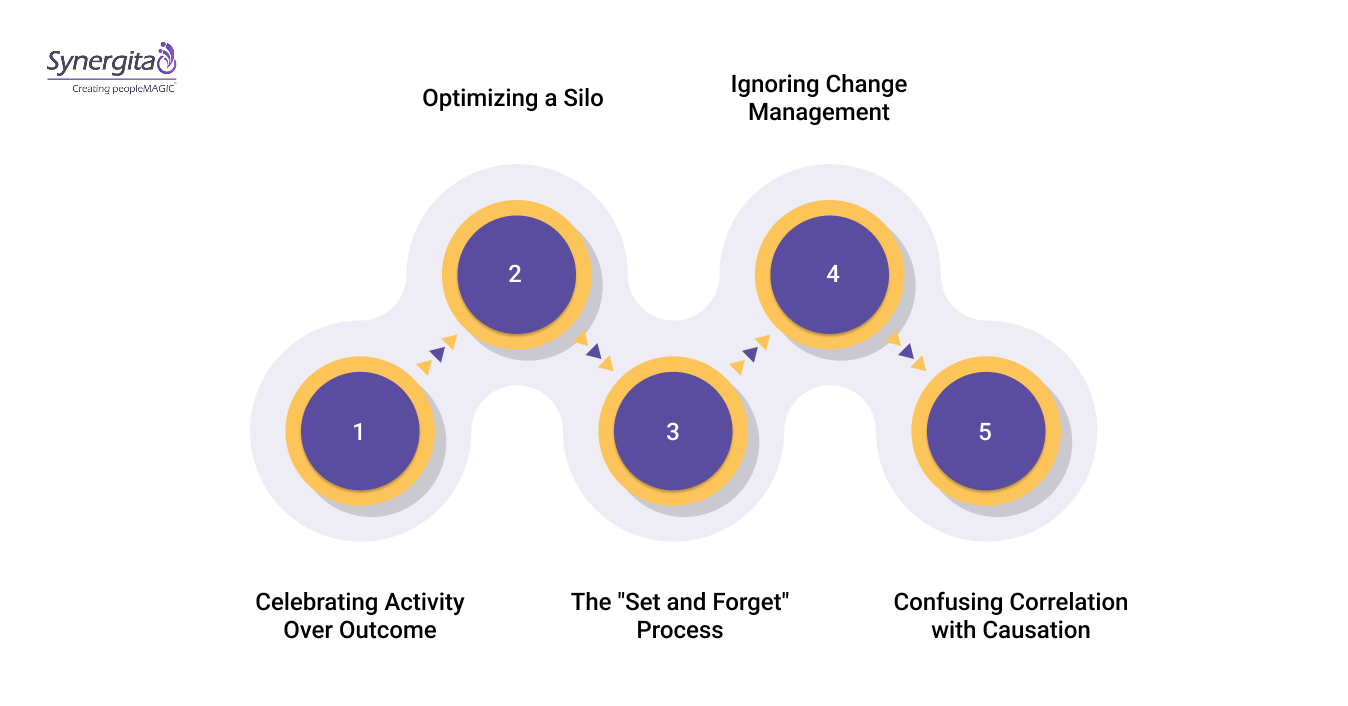
1. Celebrating Activity Over Outcome
Many teams mistake holding workshops or mapping out workflows for actual process improvement success. If you document a process but don’t measure a resulting change in speed or quality, you haven’t actually improved anything.
How to avoid:
- Ensure every Key Result measures a specific output or a reduction in waste.
- Use the “So That?” test to link every activity to a measurable business outcome.
- Reject KRs that only track the completion of meetings or document drafts.
2. Optimizing a Silo
Making one department faster can often create a massive backlog for the next team in the chain. This local optimization ignores the broader organizational flow and can actually decrease your overall delivery speed.
How to avoid:
- Use cross-functional OKRs that involve stakeholders from both upstream and downstream teams.
- Measure the “End-to-End” lead time rather than just departmental cycle times.
- Conduct regular alignment meetings to ensure one team’s speed isn’t another’s bottleneck.
3. The “Set and Forget” Process
Drafting a new workflow is easy, but ensuring that people actually follow it over the long term is much harder. Without regular monitoring, teams often revert to their old, inefficient habits within a few weeks of the “improvement.”
How to avoid:
- Include a Key Result for “adherence rate” or “process compliance score” in your plan.
- Implement automated checks or triggers that flag when a process is not being followed.
- Review process health metrics weekly during existing team stand-ups or meetings.
4. Ignoring Change Management
Forcing a new process on a team without explaining the benefits leads to resistance and eventual failure of the initiative. You must account for the human element of change to ensure your technical improvements actually stick.
How to avoid:
- Set a Key Result related to team sentiment or adoption rates of the new tool.
- Involve frontline workers in the goal-setting process to gain their direct buy-in.
- Provide clear training and feedback loops to support employees through the transition.
5. Confusing Correlation with Causation
Claiming a business outcome was due to a process change without proper isolation can lead to false strategic conclusions. You must use data to prove that your specific intervention was the driver of the improved performance.
How to avoid:
- Use controlled experiments or A/B tests for process changes whenever possible.
- Track multiple variables to ensure other external factors aren’t skewing your results.
- Rely on hard data from your integrated platforms rather than anecdotal evidence.
Refining these areas sets the stage for adopting the advanced techniques used by the world’s most agile organizations.
Also read: 15 Customer Support OKR Examples: The Complete Guide to Scaling Support Quality
Best Practices for Sustained Process Improvement with OKRs
Sustaining a high-performance culture requires more than just a good list of targets; it requires a commitment to radical transparency. Your goal-setting process must be visible to everyone, from the executive board to the frontline operations staff.
This openness creates a sense of shared ownership that is vital for surviving the lean periods common in business.
Consider these advanced strategies to refine your organizational performance:
1. Prioritize Radical Transparency
Publish your quarterly objectives in a shared digital space where every employee can see real-time progress on key initiatives. When everyone sees the numbers, they feel a greater sense of connection to the collective mission of the firm.
Impact:
- Eliminates departmental silos and promotes cross-functional collaboration.
- Increases individual motivation by showing how small tasks ladder up to big goals.
- Reduces the need for repetitive status update meetings across the team.
2. Foster a Culture of Psychological Safety
Encourage your teams to set ambitious “stretch” goals where hitting 70% to 80% is considered a massive success. If employees fear termination for missing a target, they will only set safe, easy goals that don’t drive real innovation.
Impact:
- Stimulates creative problem-solving and higher risk-taking among staff.
- Leads to bold breakthroughs in process efficiency that safe goals would miss.
- Improves employee retention by creating a supportive environment for learning.
3. Standardize Your Review Rhythms
Establish a predictable schedule for planning, grading, and resetting your goals to create a consistent organizational heartbeat. This rhythm prevents goal-setting from feeling like a special event and makes it a standard part of your operations.
Impact:
- Automates strategic focus and reduces administrative friction during transitions.
- Ensures that your processes are continuously reviewed and never become stagnant.
- Provides a consistent platform for celebrating wins and analyzing failures as a team.
Maintaining this level of discipline is significantly easier when you have the right technical infrastructure in place.
Synergita: Moving from Strategy to Unified Execution
Many leaders attempt to manage complex process improvements using static spreadsheets or fragmented project management tools. This manual approach obscures real-time progress, creates version control chaos, and makes aligning disparate teams manually intensive.
You waste valuable time aggregating data instead of analyzing it to guide your mission-driven organization toward success.
Synergita provides a unified cloud platform designed specifically for the strategic and operational needs of modern, high-growth organizations. Our solution turns your strategic framework into a dynamic, visible system that connects top-level strategy to daily execution.
- Visual Goal Alignment: Cascade your mission into objectives with a clear hierarchy tree to show everyone their impact.
- Integrated Performance Management: Connect goal progress directly to performance conversations and individual development plans within a single module.
- Automated Progress Tracking: Eliminate manual updates with automated check-ins and configurable dashboards that provide instant visibility into health.
- AI-Powered Sentiment Analysis: Use our engagement tools to capture staff feedback and gauge morale before it impacts your goals.
This integrated approach ensures your strategy is a living system for alignment rather than a static administrative exercise.
Also read: IT OKR Examples: Top 15 Objectives And Key Results
Conclusion
Effective process improvement requires moving beyond project completion to measurable outcome delivery. The OKR framework provides the structure to make this shift. By implementing the examples and avoiding the common traps outlined, your team can demonstrate clear operational and financial impact.
Synergita is designed to support this exact methodology. It provides the visibility and alignment tools necessary to manage process OKRs at scale.
See how Synergita can structure your process improvement goals. Book a demo to discuss your specific operational challenges.

FAQs
Q. How often should process improvement OKRs be reviewed?
While formal cycles are typically quarterly, you should review progress in brief bi-weekly or monthly check-ins. This rhythm allows you to discuss blockers, adjust tactics, and keep the team aligned with the mission throughout the period.
Q. What is the biggest mistake when starting with OKRs?
The most common error is creating too many objectives at once, which dilutes your resources and creates a sense of failure. Start with a small pilot in one department to learn the rhythm before rolling it out organization-wide.
Q. How do OKRs differ from traditional KPIs for process improvement?
KPIs are health metrics monitored continuously to ensure a process is stable, while OKRs are used to drive specific changes. You might use a KPI as a baseline and set an OKR to improve that metric over a quarter.
Q. Can OKRs work with a remote or hybrid workforce?
Yes, but they require a centralized digital platform like Synergita to maintain visibility and alignment across different locations. Transparent goal tracking ensures everyone remains connected to the mission regardless of where they work.
Q. How do you handle “failed” OKRs at the end of a quarter?
Treat every missed key result as a valuable data point that informs your strategy for the next planning cycle. Analyze whether the goal was too ambitious or if your execution strategy lacked the necessary resources to succeed.
Q. Should OKRs be linked directly to employee compensation?
It is best to separate OKRs from financial rewards to encourage employees to set ambitious, high-impact goals. Linking them directly often leads to “sandbagging,” where staff only set safe targets they are certain to achieve.