Tracking performance effectively is critical for businesses aiming to stay competitive in 2025. With teams, processes, and objectives becoming more complex, relying on spreadsheets or manual reporting is no longer enough. KPI tools provide real-time insights, visualize progress, and help leaders make data-driven decisions across departments.
According to Global Growth Insights, 41% of enterprises have adopted KPI software, underscoring the growing reliance on data-driven performance management. From monitoring sales growth and customer satisfaction to evaluating employee performance and operational efficiency, the right KPI tool can turn raw data into actionable insights that drive results.
In this blog, we’ll explore the top 15 KPI tools that can help your organization track performance seamlessly and make smarter business decisions.
At a glance:
- KPI tools turn raw data into actionable insights, helping teams track performance, spot trends, and make informed decisions across departments.
- Real-time dashboards, customizable reports, and alerts improve visibility and allow timely interventions before issues escalate.
- Integrations with multiple systems consolidate data, reducing manual work and providing a single source of truth for decision-making.
- Properly chosen and effectively used KPI tools align team efforts with organizational goals, improving efficiency, accountability, and measurable results.
- Regular review and strategic use of KPI tools ensure insights stay relevant and drive continuous improvement in performance management.
What Are KPI Tools and Why They Matter
KPI tools are software solutions that help organizations measure, track, and manage key performance indicators (KPIs) across teams and processes. They gather data from multiple sources, display it in dashboards or reports, and provide insights that guide smarter decisions.
By using KPI tools, organizations gain clear visibility into performance and can act on insights in real time.

Some key benefits include:
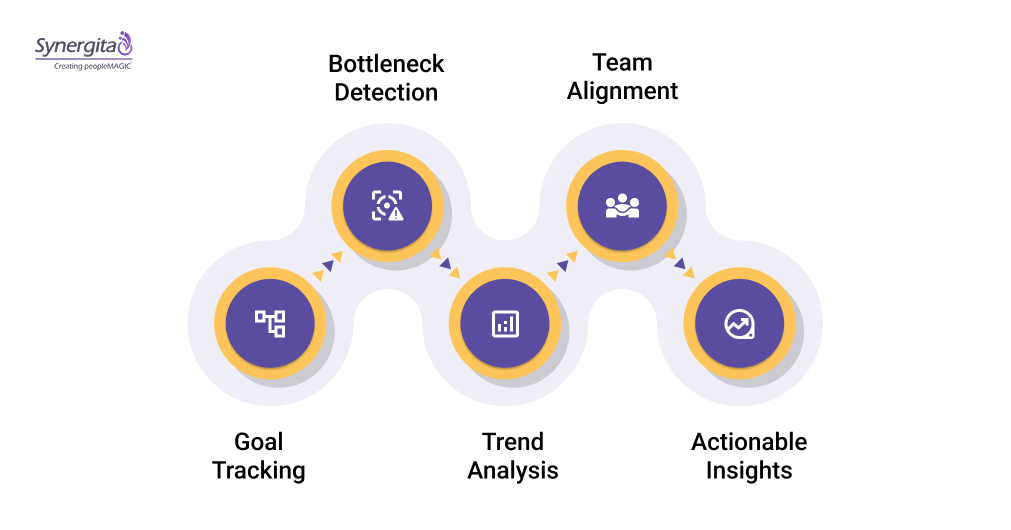
- Goal Tracking: Keeps your projects and team objectives on target by continuously monitoring progress. KPI tools also lets you see which goals are on track, which need attention, and where adjustments are required to achieve results.
- Bottleneck Detection: Quickly identifies where processes are slowing down so you can remove obstacles and keep work flowing efficiently, preventing delays and frustration.
- Trend Analysis: Detects patterns in performance over time, helping you anticipate challenges, plan ahead, and make informed decisions rather than reacting to problems after they occur.
- Team Alignment: Ensures everyone in your organization is working toward the same objectives. KPI tools also clarify priorities, reduce duplicated efforts, and keep all teams coordinated on shared outcomes.
- Actionable Insights: Transforms raw data into insights that you can act on immediately. Instead of guessing, you get clear evidence to guide decisions, improve strategies, and measure results effectively.
These tools replace guesswork with data-backed decision-making, making it easier to monitor success and address issues before they escalate.
Essential Features to Look for in KPI Tools
Tracking KPIs is only useful if the tool you use provides the right capabilities. Understanding the key features of effective KPI tools ensures you can monitor performance, uncover trends, and take timely action.
- Real-Time Dashboards: See exactly how your projects and teams are performing at any moment. No more waiting for end-of-month reports. You can spot issues and wins as they happen.
- Customizable Reports: Build reports that actually reflect your priorities. Focus on the metrics that matter to you, your team, or your project without sifting through irrelevant data.
- Data Integration: Pull together information from multiple systems, including HR, sales, and finance, so you get one clear view of performance instead of juggling spreadsheets.
- Alerts and Notifications: Get instant warnings when KPIs fall off track. This way, you can act fast instead of reacting after problems have already escalated.
- Trend Analysis and Forecasting: Understand patterns in your data and anticipate what is coming next. This helps you plan resources, predict outcomes, and avoid surprises.
- Collaboration and Sharing: Share insights across teams without extra effort. Everyone stays aligned on goals, progress, and priorities.
- Mobile Accessibility: Keep track of KPIs on the go. Whether you are in meetings or traveling, you will not miss critical updates.
These features turn raw numbers into actionable insights, helping you spot trends, make informed decisions, and keep your team aligned with what truly drives results.
Also read: KPI Monitoring That Works: What to Track, Why It Matters, and How to Do It Right
Top 15 KPI Tools to Track Performance in 2025
Measuring and managing performance is only effective when you have the right tools. KPI tools help you visualize data, uncover trends, and make informed decisions that keep teams aligned and goals on track.
Here’s a curated list of the top platforms to help you track, analyze, and act on KPIs:
1. Synergita
Synergita combines performance management, goal tracking, and engagement features in one platform, giving you a clear view of how your teams are performing and progressing. Its dashboards make it easy to track KPIs in real time, while insights help you identify patterns, bottlenecks, and areas that need attention.
Key features:
- Goal Setting and Tracking: Set clear objectives for individuals, teams, and departments, and monitor progress in real time. Aligning goals with organizational priorities ensures everyone knows what matters most.
- Continuous Feedback: Keep performance conversations ongoing instead of waiting for annual reviews. Real-time feedback helps managers and employees course-correct quickly and stay on track.
- 360-Degree Feedback: Collect performance insights from peers, managers, and direct reports. This holistic view helps you spot strengths, areas for growth, and potential skill gaps.
- Customizable Dashboards and Reports: Visualize KPIs in ways that make sense for your organization. Tailor dashboards to show the metrics that matter most to your teams and leadership.
- Analytics and Insights: Go beyond tracking numbers. Synergita’s analytics help you uncover trends, identify top performers, and pinpoint areas needing attention—turning data into decisions.
2. Tableau
With powerful data visualization capabilities, Tableau lets teams connect multiple data sources and create interactive dashboards that reveal trends, forecast risks, and simplify KPI monitoring.
Key Features:
- Interactive Dashboards: Build dynamic KPI visualizations
- Data Integration: Connects to multiple internal and external data sources
- Trend Analysis: Predictive insights to identify patterns and risks
3. Power BI
Power BI consolidates HR, finance, and operational data into unified dashboards, providing interactive reports that help organizations track KPIs and make informed business decisions.
Key Features:
- Unified Data Views: Combine data from HR, finance, and operations
- Visual Analytics: Dynamic charts and KPI visualizations
- Custom Metrics: Track business-specific KPIs aligned to goals
4. Klipfolio
Klipfolio delivers real-time KPI dashboards with pre-built templates and integrations, enabling teams to monitor performance continuously and respond quickly to changing metrics.
Key Features:
- Live Dashboards: Monitor KPIs instantly
- Templates: Pre-built and customizable dashboards
- Integrations: Connects to multiple business systems
5. Databox
Databox brings mobile-first analytics to business KPIs, offering scorecards, alerts, and app integrations that keep teams informed of performance trends anytime, anywhere.
Key Features:
- Mobile Dashboards: Access KPIs anytime
- Alerts & Scorecards: Track performance and deviations
- Data Integration: Connect multiple apps and spreadsheets
6. Geckoboard
Geckoboard provides visual KPI dashboards that help teams monitor key metrics at a glance, enabling faster decision-making and keeping organizational performance visible and actionable.
Key Features:
- Visual Dashboards: Clear, team-focused KPI views
- Real-Time Updates: Track metrics live
- Integrations: Pull data from business tools
7. Google Data Studio
Google Data Studio transforms raw data into interactive, shareable dashboards, allowing teams to monitor KPIs across departments and easily communicate performance insights.
Key Features:
- Custom Reports: Build dashboards tailored to teams
- Data Connectivity: Integrate Google and external data sources
- Collaboration: Share dashboards and reports easily
8. Zoho Analytics
Zoho Analytics delivers analytics and reporting for SMBs, helping teams consolidate data, track KPIs, and uncover actionable insights with customizable dashboards.
Key Features:
- Report Builder: Drag-and-drop report creation
- Dashboard Templates: Pre-built KPI dashboards
- Multi-Source Integration: Consolidate data from multiple systems
9. monday.com
monday.com combines workflow management with KPI tracking, offering dashboards and automation that give teams visibility into performance and operational metrics.
Key Features:
- Visual Dashboards: Track KPIs alongside workflows
- Automation: Streamline reporting and task tracking
- App Integrations: Connect with multiple business tools
10. Workday
Workday provides enterprise-level analytics for HR, finance, and operations, helping organizations monitor KPIs, forecast trends, and make data-driven decisions at scale.
Key Features:
- Enterprise Dashboards: Monitor workforce and financial metrics
- Predictive Insights: Forecast performance and trends
- Reporting: Comprehensive reports for large organizations
11. Sisense
Sisense simplifies complex business data, enabling teams to create interactive KPI dashboards, analyze trends, and make informed decisions across departments.
Key Features:
- Data Modeling: Combine multiple data sources for analysis
- Interactive Dashboards: Visualize KPIs dynamically
- AI-Powered Insights: Detect trends and anomalies automatically
12. SimpleKPI
SimpleKPI is a cloud-based platform that allows teams to track, visualize, and act on metrics, making progress toward goals transparent and measurable.
Key Features:
- Dashboard Widgets: Display KPIs visually
- Custom Metrics: Track organization-specific goals
- Alerts & Notifications: Highlight underperformance
13. Cascade
Cascade links team objectives to organizational goals, helping leaders monitor KPIs, track progress, and align strategies for improved performance outcomes.
Key Features:
- Goal Alignment: Link KPIs to strategic objectives
- Visual Dashboards: Track performance progress visually
- Reporting Tools: Generate performance reports easily
14. Salesforce
Salesforce offers CRM with built-in analytics and KPI tracking, giving teams insights into sales performance, pipeline health, and business metrics across departments.
Key Features:
- Sales Dashboards: Track revenue, opportunities, and KPIs
- Custom Reporting: Build reports tailored to business objectives
- Predictive Analytics: Forecast trends and sales outcomes
15. Qlik Sense
Qlik Sense allows teams to explore and visualize business data, build KPI dashboards, and identify trends that inform better operational and strategic decisions.
Key Features:
- Self-Service Analytics: Users can explore and analyze data independently
- Interactive Visualizations: KPI dashboards with drill-down capabilities
- Data Integration: Pulls data from multiple systems seamlessly
Tracking performance is only effective if you have the right tools to make sense of your data. The KPI platforms listed here help you monitor progress, uncover trends, and act on insights in real time.
How to Choose the Right KPI Tool for Your Organization
A KPI tool only works if it aligns with how your team measures success. Choose one that surfaces trends clearly, connects metrics across systems, and supports timely, data-driven decisions.

Here’s a closer look:
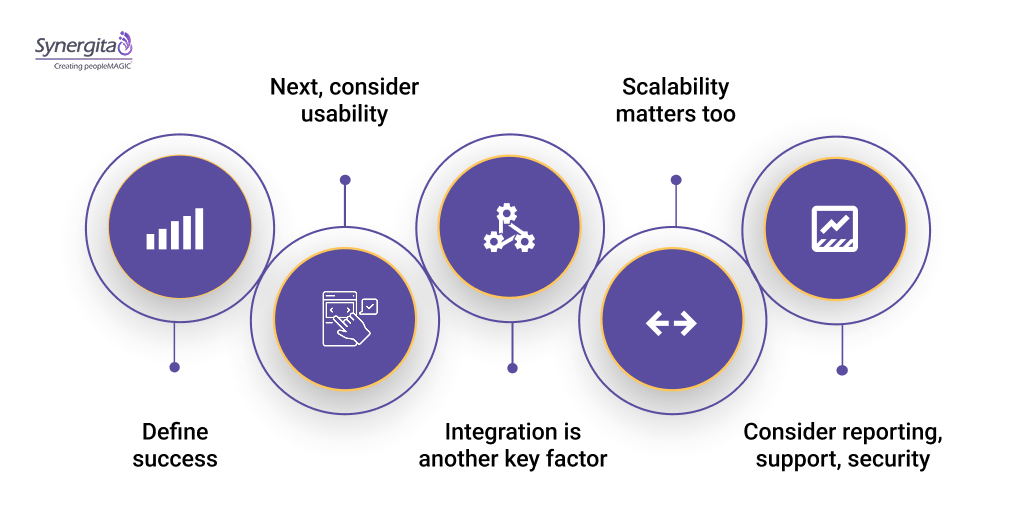
- Start by defining what success looks like for your organization. Are you measuring sales performance, project delivery, employee productivity, or financial KPIs? Knowing your priorities ensures you focus on tools that track the metrics that drive real outcomes.
- Next, consider usability. A tool that’s difficult to navigate will sit unused, no matter how powerful it is. Look for platforms with intuitive dashboards, clear visualizations, and easy customization. Your team should be able to access insights quickly without a steep learning curve.
- Integration is another key factor. Your KPI tool should connect seamlessly with the systems you already use, like HRIS, CRM, ERP, or project management software. Consolidated data means fewer manual exports, fewer errors, and a single source of truth for decision-making.
- Scalability matters too. Choose a platform that grows with your team or organization. Whether you’re adding more users, tracking additional KPIs, or incorporating advanced analytics, your tool should adapt without forcing a platform change later.
- Finally, look at reporting flexibility, support, and security. Dashboards should present insights in a way that stakeholders can act on. Reliable vendor support and strong data protection policies ensure your KPI tool remains a trusted, long-term partner.
By evaluating these factors, you can select a KPI tool that not only tracks numbers but actively drives performance and alignment across your organization.
Also read:How to Implement Key Performance Indicators (KPIs) Effectively
How to Get the Most Out of Your KPI Tool
Having a KPI tool is just the start. To truly benefit, you need to use it strategically across your team and processes. Here are some ways to maximize its impact:

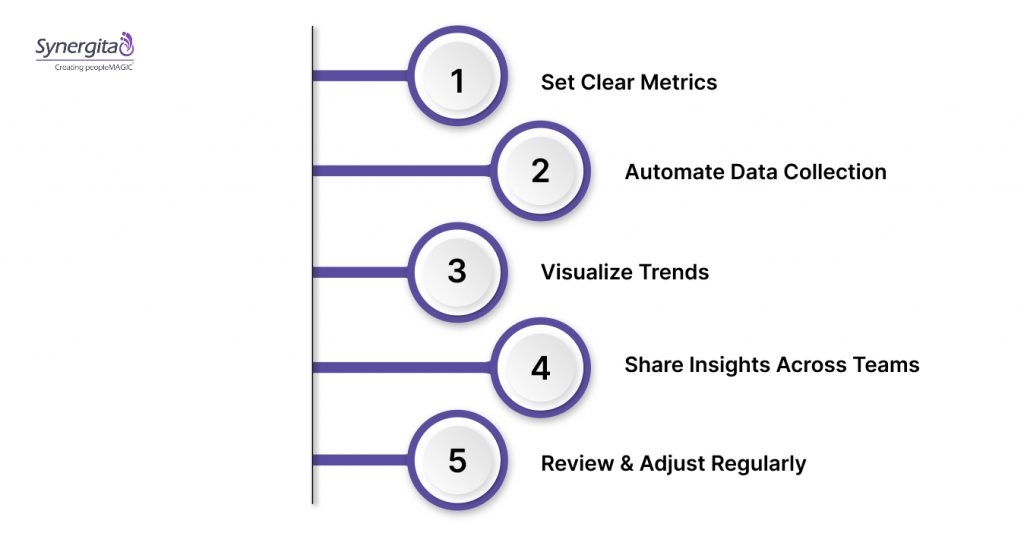
- Set Clear Metrics: Define which KPIs matter most to your business objectives. Avoid tracking everything—focus on metrics that drive decisions and outcomes.
- Automate Data Collection: Connect all relevant systems to your KPI tool. Automated updates reduce errors, save time, and give you real-time insights without manual effort.
- Visualize Trends: Use dashboards to spot patterns, anomalies, and opportunities at a glance. Visual context helps teams respond faster to challenges or changes.
- Share Insights Across Teams: Make dashboards and reports accessible to stakeholders. Transparency ensures everyone is aligned and accountable for key metrics.
- Review and Adjust Regularly: KPIs aren’t static. Reassess your metrics periodically, refine reporting, and adjust dashboards as business priorities evolve.
Following these steps helps your KPI tool become a true driver of informed decisions and measurable business growth.
Final Words
Tracking KPIs effectively is essential for understanding performance, spotting trends, and making informed decisions. The right KPI tool helps turn data into actionable insights, providing clarity across teams and processes.
Moreover, choosing the right tool and using it effectively ensures every effort contributes to measurable results.
Platforms like Synergita integrate performance analytics, engagement tracking, and OKR management, giving you a real-time view of workforce and organizational performance. With customizable dashboards, automated reporting, and data-driven insights, your team can monitor progress, address gaps early, and stay aligned with strategic goals.
Book a demo today to see how your KPIs can guide smarter decisions and drive meaningful outcomes across your organization.
FAQs
1. Why are KPI tools important for businesses?
They provide a clear view of performance, highlight bottlenecks, and guide decisions that keep teams aligned with organizational goals.
2. How do KPI tools improve team performance?
By visualizing progress, highlighting gaps, and enabling real-time insights, KPI tools help managers intervene early and optimize team outcomes.
3. Can KPI tools integrate with existing systems?
Yes. Most KPI tools connect with HRIS, CRM, ERP, and other platforms, consolidating data for unified reporting and actionable insights.
4. How should I choose the right KPI tool?
Consider your reporting needs, integration requirements, scalability, and ease of use to pick a tool that fits your organization’s goals and workflows.
5. Do KPI tools support predictive insights?
Many KPI tools, like Synergita or Power BI, offer analytics and forecasting features to predict trends, risks, and future performance patterns.
6. Can small businesses benefit from KPI tools?
Absolutely. Scalable tools provide actionable insights for teams of any size, improving alignment, efficiency, and strategic decision-making.


