

Operational success depends on turning complex processes into measurable results. But without structured OKRs, teams struggle to focus on the most important outcomes. Before exploring practical examples, here are a few key takeaways that explain how effective operations OKRs work.
Quick Takeaway
- Operations OKRs must be outcome-driven, not activity-based. Instead of vague goals like “improve efficiency,” teams should define measurable key results.
- The 10 OKR examples in this guide provide specific, measurable frameworks for efficiency, quality, cost management, delivery predictability, and customer experience across various business operations.
- High-performing operations teams limit themselves to 2–3 strategic objectives per quarter, to ensure they can focus on meaningful improvements rather than scattered initiatives.
- OKRs are a learning system, not a performance scorecard. Real progress comes from realistic targets, retrospectives, cross-functional alignment, and continuous improvement.
Operations teams are the backbone that transform strategy into reality, day in and day out. Yet many struggle to translate execution into measurable objectives and key results (OKRs) that drive real impact.
In fact, 48% of organizations fail to reach at least half of their strategic targets. The result? Generic objectives like “improve efficiency” without clear metrics; misaligned execution across departments. Teams working hard but unable to prove their value. And the worst thing is a lack of accountability when things don’t go as planned.
So, in this guide, we will share 10 practical OKR examples specifically designed for operations teams, complete with templates you can adapt immediately.
Whether you’re in manufacturing, supply chain, IT operations, or business operations, you’ll find the frameworks to improve efficiency, quality, cost management, and delivery predictability.
Best OKR Examples for Operations Teams: 10 Proven Templates for Execution Excellence
Here are the top 10 OKR examples for operations team.
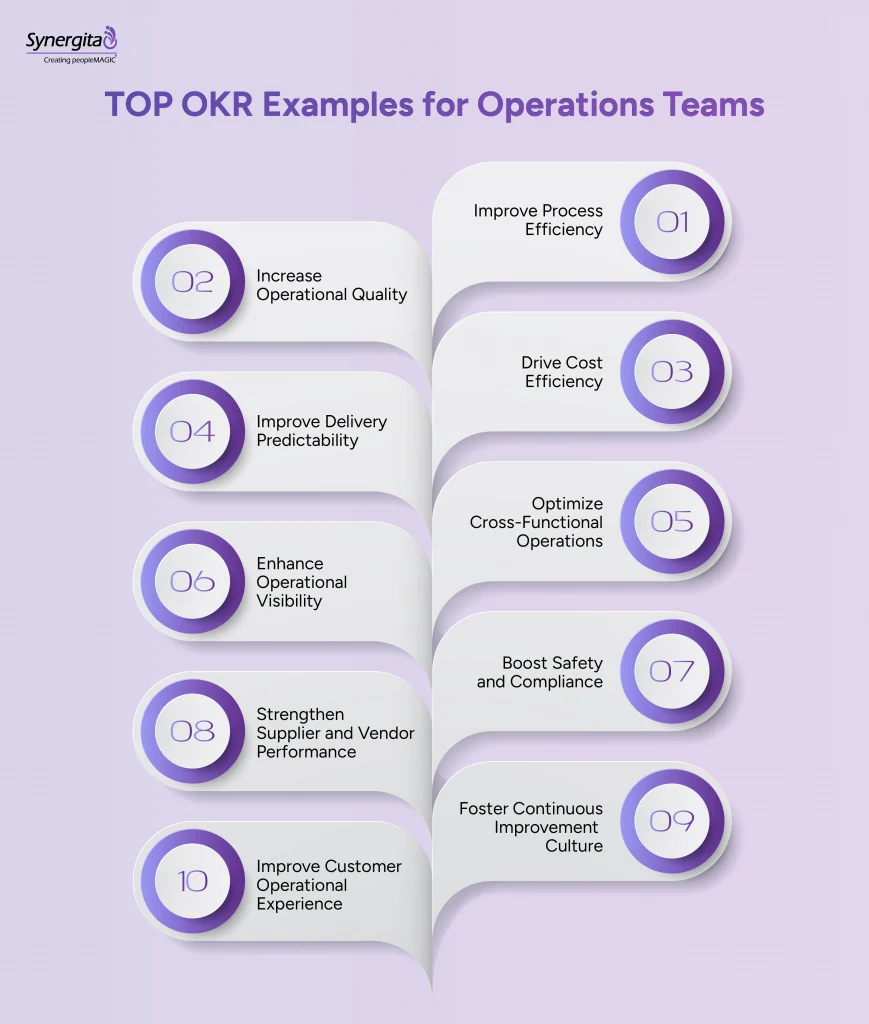
1. Improve Process Efficiency
Why it matters: Process efficiency directly impacts speed, cost, and capacity. Faster processes mean you can do more with the same resources.
Sample OKR:
- Objective: Improve Process Efficiency
- KR1: Reduce average process cycle time from 48 hours to 32 hours
- KR2: Automate 35% of manual operational tasks currently done in spreadsheets
- KR3: Increase throughput by 25% without adding headcount
How to customize:
- Replace “48 hours to 32 hours” with your actual baseline and target
- Specify which processes you’re targeting (e.g., “order processing” or “invoice approval”)
- Tie throughput to specific business impact (e.g., “process 500 additional orders per week”)
Common pitfall: Don’t just say “automate tasks”, measure the percentage or number of tasks automated, or the time saved.
2. Increase Operational Quality
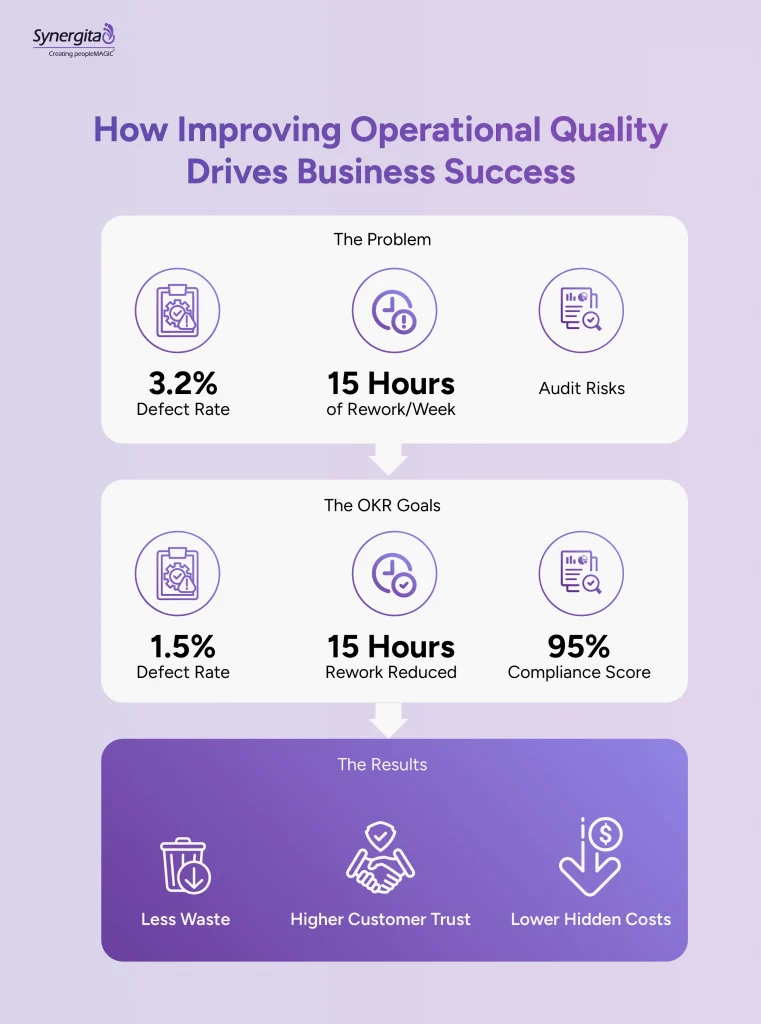
Why it matters: Quality issues create rework, customer dissatisfaction, and hidden costs. Improving quality reduces waste and builds trust.
Sample OKR:
- Objective: Increase Operational Quality
- KR1: Decrease defect rate from 3.2% to 1.5%
- KR2: Reduce rework time by 15 hours per week across the team
- KR3: Achieve 95% compliance score in quarterly quality audits
How to customize:
- Define what “defect” means in your context (e.g., order errors, product defects, data errors)
- Track rework in hours saved or percentage reduction
- Align audit metrics with your specific compliance framework (e.g., ISO, Six Sigma).
Common pitfall: Tracking defects discovered vs defects escaped. Focus on defects that reach customers or downstream processes.
Suggested Reading: How to Improve Operational Performnce Consistently
3. Drive Cost Efficiency
Why it matters: Operations teams are often measured by cost control. Smart OKRs balance cost reduction with quality and speed.
Sample OKR:
- Objective: Drive Cost Efficiency
- KR1: Reduce operational cost per unit from $45 to $38
- KR2: Decrease vendor cost overruns by 60%
- KR3: Increase resource utilization from 72% to 85%
How to customize:
- Choose the right cost metric: cost per unit, total OpEx, cost as % of revenue
- For vendor management, track cost variance or contract compliance
- Define “resource” clearly: people, equipment, warehouse space, etc.
Common pitfall: Cutting costs at the expense of quality or speed. Always pair cost OKRs with quality or delivery metrics.
4. Improve Delivery Predictability
Why it matters: Reliable operations enable better planning across the organization and build customer trust.
Sample OKR:
- Objective: Improve Delivery Predictability
- KR1: Increase on-time delivery rate from 78% to 93%
- KR2: Reduce delivery variance from ±5 days to ±2 days
- KR3: Establish weekly forecast accuracy ≥ 90%
How to customize:
- Define “on-time” clearly (within 24 hours? same day? exact time?)
- Measure variance in days, hours, or percentages based on your context
- Connect forecast accuracy to specific planning horizons (weekly, monthly, quarterly)
Common pitfall: Focusing only on the on-time rate without addressing variability. A stable 85% is often better than an erratic 90%.
5. Optimize Cross-Functional Operations
Why it matters: Most operational breakdowns happen at handoffs between teams. Smooth collaboration accelerates the entire value stream.
Sample OKR:
- Objective: Optimize Cross-Functional Operations
- KR1: Implement cross-team SLA with engineering, achieving 90% adherence
- KR2: Reduce handoff delays between ops and sales by 40%
- KR3: Improve coordination score from 6.2 to 8.5 (via internal survey)
How to customize:
- Identify your most critical cross-functional interfaces
- Measure handoff delays in time (hours/days) or number of escalations
- Use surveys, NPS, or feedback scores to measure relationship quality
Common pitfall: Creating SLAs without teeth. Ensure there’s visibility and accountability for meeting them.
6. Enhance Operational Visibility
Why it matters: You can’t improve what you can’t measure. Proactive OKR tracking and better visibility enable faster decision-making and proactive problem-solving.
Sample OKR:
- Objective: Enhance Operational Visibility
- KR1: Launch a real-time operational dashboard tracking 8 key metrics
- KR2: Reduce monthly reporting turnaround time from 5 days to 1 day
- KR3: Achieve 98% data accuracy in core operational systems
How to customize:
- Specify which metrics matter most for your dashboard
- Define what “real-time” means (live updates, hourly refresh, daily?)
- Measure data accuracy via audits or reconciliation processes
Common pitfall: Building dashboards no one uses. Include adoption metrics (e.g., “80% of ops managers log in weekly”).
7. Boost Safety and Compliance
Why it matters: In many operations contexts, safety and compliance are non-negotiable. OKRs help maintain zero-incident cultures.
Sample OKR:
- Objective: Boost Safety and Compliance
- KR1: Achieve zero recordable safety incidents for the quarter
- KR2: Maintain 100% compliance on all regulatory audits
- KR3: Reduce near-miss safety reports by 50% through preventive measures
How to customize:
- Define “recordable” based on your industry standards (OSHA, etc.)
- Specify which compliance frameworks apply (SOC 2, GDPR, industry-specific)
- Focus on leading indicators (near-misses, training completion), not just lagging indicators
Common pitfall: Only measuring incidents. Include proactive safety measures like training hours or safety checklist completion.
8. Strengthen Supplier and Vendor Performance
Why it matters: Your operations are only as reliable as your weakest supplier. Vendor performance directly impacts your delivery and quality.
Sample OKR:
- Objective: Strengthen Supplier & Vendor Performance
- KR1: Improve on-time supplier delivery rate from 81% to 94%
- KR2: Reduce vendor defect rate from 2.8% to 1.2%
- KR3: Achieve 90% vendor SLA compliance across top 10 suppliers
How to customize:
- Prioritize top suppliers by spend or criticality
- Define defect criteria specific to what you’re purchasing
- Build supplier scorecards to track multiple dimensions (quality, delivery, cost)
Common pitfall: Not sharing metrics with suppliers. Transparency drives improvement.
9. Foster Continuous Improvement Culture
Why it matters: Operational excellence is a journey, not a destination. Building an improvement mindset ensures ongoing gains.
Sample OKR:
- Objective: Foster Continuous Improvement Culture
- KR1: Implement and complete 12 Lean/Kaizen improvement initiatives
- KR2: Reduce operational waste by 20% (time, materials, or cost)
- KR3: Train 85% of the operations team on process improvement methodologies
How to customize:
- Choose your methodology: Lean, Six Sigma, Kaizen, Agile, Theory of Constraints
- Measure waste in whatever form is most relevant (time, money, defects, materials)
- Track not just training completion but application (e.g., “50% of team leads 1+ improvement project”)
Common pitfall: Measuring activity (training hours) instead of impact (projects completed, waste reduced).
10. Improve Customer Operational Experience
Why it matters: Operations don’t happen in a vacuum; they serve customers (internal or external). Better operations = better customer outcomes.
Sample OKR:
- Objective: Improve Customer Operational Experience
- KR1: Increase customer satisfaction score (CSAT) for operations from 7.2 to 8.5
- KR2: Reduce customer operational complaints by 45%
- KR3: Decrease average service turnaround time from 36 hours to 24 hours
How to customize:
- Choose the right customer metric: NPS, CSAT, Customer Effort Score
- Define “operational complaints” (shipping delays, order errors, service quality)
- Measure turnaround time for whatever “service” means in your context
Common pitfall: Improving internal metrics while customer experience stays flat. Always connect to customer-facing outcomes.
Common OKR Mistakes Operations Teams Make (And How to Avoid Them)
Even with great templates, teams can go wrong. That’s why you should understand why OKRs fail, and how to avoid them. Here are the most common pitfalls, and how to avoid them.
1. Output-Based Instead of Outcome-Based KRs
What it looks like:
- Implement a new ERP system
- Hire 3 operations analysts.
- Conduct 5 process improvement workshops
Why it’s wrong: These are activities, not results. You could do all three and still not improve operational performance.
How to fix it:
- Reduce order processing time by 30% via ERP automation
- Improve reporting accuracy to 97% with enhanced analytics capability
- Reduce cycle time by 25% through process redesign initiatives
2. Too Many OKRs
What it looks like: An operations team with 5 objectives and 25 key results.
Why it’s wrong: Trying to improve everything means improving nothing. Teams get overwhelmed and make minimal progress on any single goal.
How to fix it:
- Limit to 2-3 objectives per quarter maximum
- Use the “if we could only achieve one thing this quarter, what would it be?” test
- Park other good ideas in a backlog for future quarters
3. Setting Unrealistic Targets
What it looks like:
- Going from 65% to 98% on-time delivery in one quarter
- Reducing costs by 50% while maintaining quality
- Achieving zero defects when you’ve never been below 5%
Why it’s wrong: Unrealistic OKRs demoralize teams and encourage sandbagging in future cycles.
How to fix it:
- Use historical data to set ambitious but achievable targets
- Apply the 70% rule: aim for targets that have a 60-70% probability of success
- Break massive transformations into quarterly milestones
4. Treating OKRs Like Performance Evaluations
What it looks like: Bonus compensation tied directly to OKR achievement, or missed OKRs resulting in negative reviews.
Why it’s wrong: When OKRs affect compensation, teams set conservative goals they know they can hit. You lose the “stretch” that drives innovation.
How to fix it:
- Separate OKRs from individual performance reviews
- Reward learning and effort, not just results
- Celebrate 70% achievement as success, 100% as exceptional
5. Ignoring Retrospectives
What it looks like: Teams set OKRs, track them briefly, then jump to the next quarter without reflection.
Why it’s wrong: You miss critical learning about what worked, what didn’t, and why. The same mistakes repeat every quarter.
How to fix it:
- Schedule 60-90 minute OKR retrospectives at quarter-end
- Ask: What did we achieve? What blocked us? What would we do differently?
- Document lessons learned and apply them to next quarter’s OKR planning
- Share successes and failures across teams
Suggested Reading: Ultimate OKR Implementation Guide
Final Takeaway
Operations teams have a unique challenge: they must maintain excellence in day-to-day execution while driving continuous improvement. OKRs provide the framework to create focus on what matters most while ensuring measurable progress.
The 10 OKR examples in this guide aren’t meant to be copied verbatim. They’re templates to spark your thinking about what operational excellence means in your specific context. Whether you’re focused on efficiency, quality, cost, delivery, safety, or customer experience, the principles remain the same.
If you’re looking for a structured way to implement these OKRs, tools like Synergita can help you align, track, and review progress in real time. Start your 14-day free trial of Synergita today.

Frequently Asked Questions
A good operational OKR is outcome-focused, measurable, aligned with the company’s strategy, and designed to improve a specific operational capability, such as efficiency, quality, cost, or predictability.
Best practice is 2–3 Objectives per quarter, each with 3–5 measurable Key Results. Too many OKRs dilute focus and impact.
KPIs track ongoing performance. OKRs should focus on improving those KPIs. Instead of simply tracking “on-time delivery,” set an OKR to increase it from 92% to 98%.
KPIs measure the stability and health of operations, whereas OKRs define improvement and transformation goals over a defined time period.